August 28, 2017

Throughout Premier Crop’s nearly 20-year history, we’ve perhaps been the most diligent at communicating that what we do – big data analysis. Within the scientific community, that would be considered “observational data analysis.”

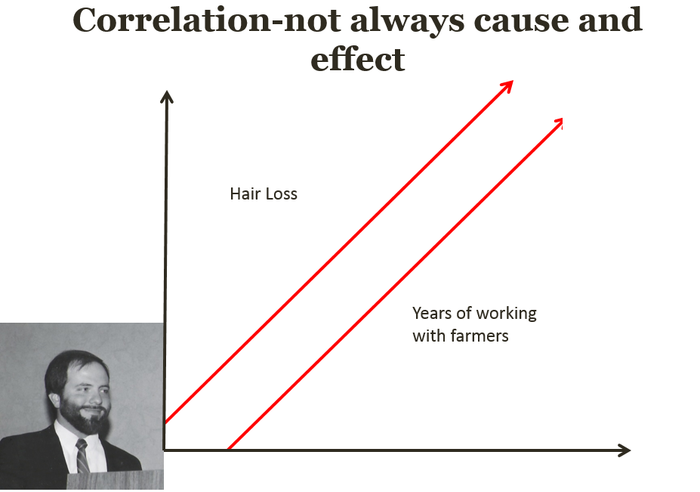
Early on, my slide deck featured this chart – a photo on the left from my earlier years versus today – to explain that observational data analysis can show us relationships and correlations. But, it stops short of proving cause and effect.
Within crop production and agronomy scientific circles, making decisions using observational data analysis has been viewed as inferior and some would argue it’s an informed guess. It has only been within the last few years – with validation of big data analytics from the dramatic investments by major ag companies – that the idea that millions of yield observations might be valuable in crop production decision-making.
For decades, the foundations of agronomic knowledge have been the results of small randomized replicated plots. That experimental design and the statistical analysis dates back to 1930’s, with Sir Ronald Fisher’s analysis of variance (ANOVA), whom many consider the father of modern statistics. All universities and industry companies have adopted and use replicated plots as the gold standard for conducting trials and proving that a change in treatment actually causes a change in yield.
Premier Crop has now added randomization and replication to our Learning Block concept with an offering we are calling Enhanced Learning Blocks. It allows us to move beyond correlation and actually prove causation.
With over 500 successful trials in the 2016 crop year, we are now able to scientifically prove the value of using variable rate technology in a grower’s operation. And the results are dramatic. In several examples, customers with 5 replications of 3 different planting rates were able to prove that the ideal seeding rate varied over 9,000 seeds per acre, with resulting yield results greater than 40 bushels per acre. That’s a swing of over $30/acre in seed cost and $140/acre in revenue.
The beauty of these experiments is that the technology you’ve already purchased in the cab does all the work – there is no slowing down or adding any hassle to do a plot. You plant, apply and harvest the same with the technology executing the experiment. We refer to Enhanced Learning Blocks as “knowledge creation at the speed of farming”!
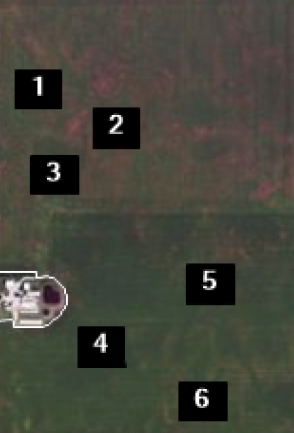
Highest rate 36K – 260 bu/ac – Okoboji soil type

Lowest rate 27K = 216 bu/acre – Harps soil type
About the Author(s)
You May Also Like


