August 24, 2012

2013 Budgets
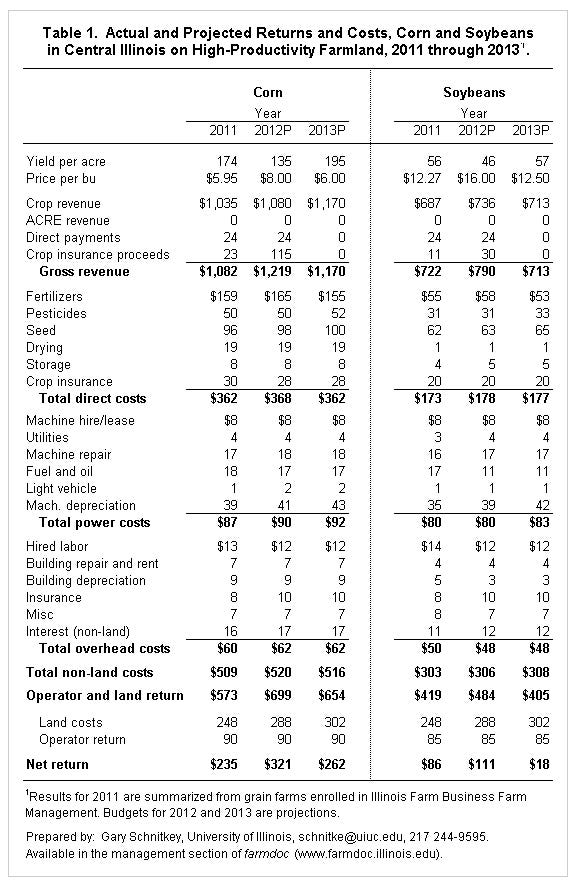
For central Illinois high-productivity farmland, 2013 yields are projected at 195 bu./acre for corn and 57 bu./acre for soybeans (see Table 1). These yields are trend-line yields. Prices used in 2013 projections are based on futures contracts and are $6/bu. for corn and $12.50/bu. for soybeans. These yields and prices result in crop revenue of $1,170/acre for corn and $713/acre for soybeans. No other revenues are included in budgets. In 2011 and 2012, $25/acre is included for direct payments. Direct payments are not included for 2013 under the assumption that a farm bill will pass that does not include direct payments.
Non-land costs for corn are projected at $516/acre in 2013, $4/acre less than the $520 non-land costs for 2012 (see Table 1). Fertilizer costs are projected to be down slightly in 2013: $165/acre in 2012 compared to $155/acre in 2013. Offsetting fertilizer declines are increases in pesticide costs ($50 in 2012 to $52 in 2013), seed costs ($98 in 2012 to $100 in 2013) and machinery depreciation ($41 in 2012 to $43 in 2013).
Non-land costs for soybeans are projected at $308/acre in 2013, $2/acre higher than the 2012 non-land costs of $306/acre (see Table 1). Fertilizer costs are projected to be down in 2013: $58/acre in 2012 compared to $53 in 2013. Offsetting fertilizer cost decreases are increased in pesticide costs ($31 in 2012 to $33 in 2013), seed costs ($63/acre in 2012 to $65 in 2013) and machinery deprecation ($39 in 2012 to $42 in 2013).
Operator and farmland returns in 2013 are projected to be $654/acre for corn and $405/acre for soybeans (see Table 1). The 2013 corn return is projected higher than the 2011 return ($573/acre) but below the projected 2012 return ($699/acre). The 2013 soybean return of $405/acre is below the 2012 return ($419/acre) and the projected 2012 return ($484/acre). These fundamentals do not suggest that increases in cash rents should occur in 2013.
A major difficulty in projecting 2013 returns is determining the corn and soybean prices to use in budgets. The $6 corn price and $12.50 soybean price represent cash prices implied from futures contracts. These prices could change a great deal between now and harvest-time 2013, resulting in large changes in profitability.
In 2013, corn returns ($654/acre in 2013) minus soybeans return ($405/acre) equals $244/acre. This 2013 difference is large compared to historical averages. From 2005 through 2011, corn-minus-soybean returns averaged $75/acre. The large projected difference in 2013 occurs because corn price is relatively high compared to the soybean price. The 2012 soybean-to-corn price ratio is 2.08. From 2006 through 2012, the soybean-to-corn price ratio averaged 2.38. Whether these relative prices persist into 2013 is an open question, depending on demand conditions and harvests in both North and South America. Whether these relative prices influence 2013 planting decisions also is an open question.
Summary
Current 2013 cost projections suggest that non-land costs will be roughly the same in 2013 as in 2012. Projected 2013 prices are based on futures contracts and result in projected 2013 operator and farmland returns of $654/acre for corn and $405/acre for soybeans. The corn return in 2013 is between the 2011 and 2012 returns. The 2013 soybean returns is below the 2011 and 2012 returns. These returns do not suggest increases in cash rents in 2013.
Appendix tables show budgets for northern Illinois, central Illinois with low productivity farmland, and southern Illinois. Look for modifications to 2013 budgets as economic conditions change.
You May Also Like


