A key weather indicator shows conditions are moving toward a full-fledged La Nina weather pattern developing, increasing the risk of dry weather occurring in the Corn Belt during the critical pollination period for corn this summer. Iowa State University Extension climatologist explained the situation in a presentation last week at the World Pork Expo in Des Moines.
"The SOI index has gone from neutral to three-fourths of the way to La Nina in the past 30 days," says Taylor. "That's about as fast as I've ever seen it move." The Southern Oscillation Index is a measure of atmospheric pressure associated with El Nino and La Nina. The SOI progressed significantly toward La Nina in May, moving from -0.54 to +0.41 in May. An index of +0.8 is considered a La Nina condition and the SOI had moved up to +0.7 as of June 15.
La Nina conditions are associated with dry conditions in Iowa and the Corn Belt, but that doesn't necessarily mean a drought is imminent. "Not every La Nina brings a drought, but every drought occurs during La Nina," says Taylor.
Timing of La Nina's arrival is very important as to crop risk
The timing of La Nina's arrival is important regarding the risk it poses for crops. Adequate moisture in July is critical for corn yields, while soybeans depend on August rainfall. If La Nina conditions are reached during June, it shifts the likelihood of a below-trend corn yield from 50-50 to about 70%, says Taylor.
"The next three weeks, from the middle of June into early July, is a crucial time. We'll be watching things very carefully over this current three week period. The later the La Nina comes, the better," says Taylor.
He says conditions so far this year are similar to 1983, which farmers remember as being very dry during July, August and September. In 1983 the rains stopped in early July and it didn't rain again significantly for the rest of the growing season in the Corn Belt. And it got hot.
Summertime temperatures and rainfall both determine crop yields, says Taylor. When high temperatures are around 85 degrees, the corn crop uses about 2 inches of water per week. But when temperatures rise to 95 degrees, the crop needs about 4 inches per week. "It's usually the temperature that determines whether we have a big crop or a small crop in the Midwest," he says. "The crop just can't get 4 inches of water out of the soil in a week."
National Weather Service forecast doesn't consider La Nina
While La Nina raises the risk of dry and hot weather, the summer outlook isn't all bad news, he points out. The National Weather Service's June 1 forecast calls for conditions to be similar to last summer, predicting cooler-than-normal temperatures in the Corn Belt. The NWS forecast gives Iowa equal chances of above- or below-normal rainfall. However, it doesn't factor in La Nina. "That's the thing to watch," says Taylor. "La Nina would do just the opposite of what the National Weather Service forecast is. They aren't considering La Nina at all."
Iowa's crops are heading into summer 2010 with adequate supplies of reserve soil moisture in most areas of the state, notes Taylor. In fact, southern Iowa and northern Missouri are dealing with excess moisture they've been continually hit by thunderstorms during the past month or so.
Climatologists are paying close attention to areas in the U.S. that are getting soaked by above normal rainfall and flooding this June. "In the past week or so, from Salt Lake City to Omaha, following along Interstate 80, that area has had above normal precipitation by 400% or 500%. And it's not too different from that for the entire month of June so far," says Taylor. "Pretty much from Salt Lake to Omaha and on down to where Interstate 35 crosses the border into Iowa and goes into Missouri. That is really the wet area compared to normal. It's not necessarily the wettest area, but compared to usual, that's what is going on."
By this time of year rainy pattern is usually north of Minneapolis
Taylor adds, "I think this is a clue as to what may be happening. Why hasn't this rainy pattern been moving up into northern Minnesota like it usually does by this time of year? After all that's why we have lakes up there called the Boundary Waters. Usually the wet weather pattern moves up to the U.S.-Canadian border by June. But it's being held down here this year perhaps because we're moving into a La Nina condition in our hemisphere. We aren't quite at a full-fledged La Nina yet. But maybe we are starting to see indications of a La Nina. We wouldn't be so suspicious of this if we hadn't seen it happen in 1983."
So, was 1983 similar to the weather Iowa is experiencing now? "It is almost a carbon copy up to mid June in 1983 and in 2010," he says. "In 1983 we had a wet winter in the Corn Belt, we had temperatures about the same in 1982 and 1983 as we have had this year and above-normal moisture. There were some spring floods. The rainfall in 1983 ended about the first week of July. Suddenly the spigot turned off and it just stayed dry for the rest of July and through most of August. Temperatures got hotter than usual. The crops weren't properly rooted because of the wet spring. The percentage cut in the yield was greater that year, in 1983, than it was in 1988—which was another dry growing season."
So far, 2010 is showing similarities to weather pattern of 1983
1983 was also the year of USDA's "payment in kind" or PIK farm program, when the government enticed a bunch of acres out of corn and soybean production to try to boost low prices. Talk about a perfect storm—U.S. planted acreage was reduced by about a third as a result of the PIK program and then a summer drought came along to further reduce the 1983 crop size even more.
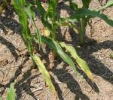
Farmers produced nubbins for corn ears, particularly in southeast, central and parts of southwest Iowa. We have better hybrids today and better technology to withstand drought. But the point is, 1983 had a very wet spring and it lasted into June, and then in early July the weather in Iowa and the heart of the Corn Belt turned hot and dry.
"In 1983, we moved out of an El Nino weather pattern rapidly during the month of May and June, just as we appear to be doing now in 2010," notes Taylor. Have we had any other period between then and now when we've seen this kind of a movement from El Nino to La Nina? "Looking at data all the way back to 1950, the year 2010 is one of the two dramatic years and 1983 was the other one," he says. "We will pay close attention to this indicator over the next three weeks."
About the Author(s)
You May Also Like


