Subscribe to receive top agriculture news
Be informed daily with these free e-newsletters

Current Brazil exports have reached 47 million metric tons compared to 48.9 million metric tons for the United States.
February 15, 2023

By Luis A. Ribera
The U.S. has been the top corn exporter for a long time averaging around 45% of the world corn exports since 2000 with a high of 67% in 2005 (Figure 1). The one exception since the turn of the century was in 2012; the most severe drought since the 1950s reduced corn production by over 13% in the largest producing states.
On the other hand, Brazil has increased its corn exports rapidly through the years securing the number two spot. Brazil’s participation in the corn export market is quite remarkable. In 2000, corn exports from Brazil accounted for only 8.2% of the world total and reached its lowest volume of exports in 2004 with less than 1%.
Brazil bounced back after claiming the top spot in 2012 and challenged the United States. Currently, Brazil exports reached 47 million metric tons compared to 48.9 million metric tons for the United States, accounting for 26.4 and 27.4 percent of total world corn exports, respectively.
The top world corn importers are EU, China, Mexico, Japan, and South Korea accounting for 47.2% (Figure 2).
Similar to Brazil in the exporting market, China’s rise as a major corn importer is remarkable. China had nearly zero corn imports from 2000 to 2008, then gradually increased its share reaching around five% in 2011, 2014, and 2019, and finally exploding as a top market for corn in 2020 and 2021.
Currently, China occupies the number two spot between the EU and Mexico. U.S. corn exports to China earlier this month were around 70% shorter than at the same point in the previous two years.
On the other hand, Brazil corn shipments to China last month reached over one million metric tons and is on track to repeat the same amount this month. Although Brazil exports to China seem to be coming at the expense of the United States, China’s continued purchases are a good sign for the world corn market.
Figure 1. Major World Exporters of Corn, MY 2012/13 – MY 2022/23
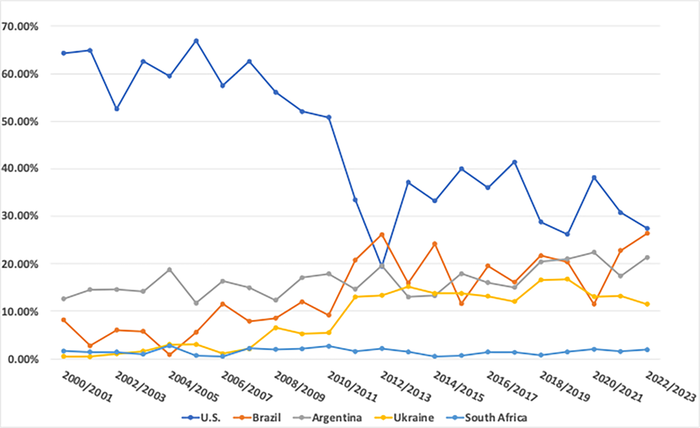
Source: Production, Supply, and Distribution (PS&D); USDA-FAS
Figure 2. Major World Importers of Corn, MY 2012/13 – MY 2022/23
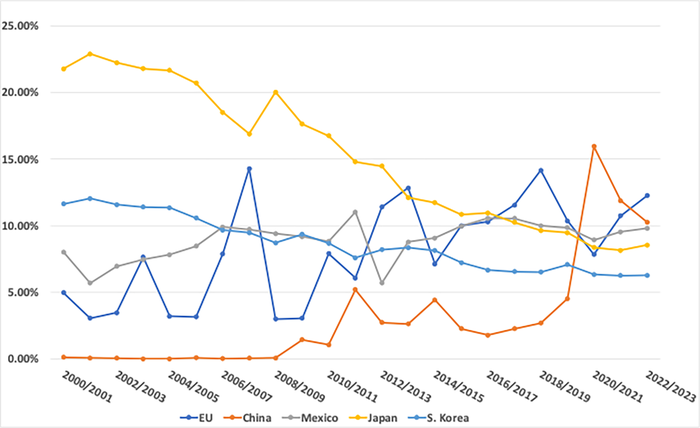
Source: Production, Supply, and Distribution (PS&D); USDA-FAS
Source: Southern Ag Today
You May Also Like
Enter a zip code to see the weather conditions for a different location.


