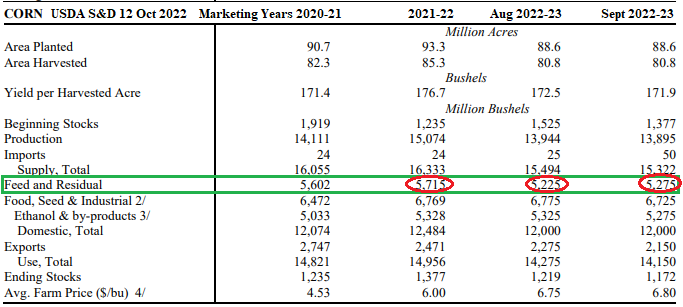
On or about the tenth of every month, the USDA issues a Supply and Demand (S&D) Report. Below is the S&D for corn issued in September 2022. Note the green box with the corn for feed use in million bushels for three different marketing years with both the August and September S&D numbers for the current marketing year:

Note USDA predicted in August a 490 million bushel decline (8.6%) in corn feed use from the marketing year ending August 31st 2022 and the current marketing year ending August 31st, 2023.
Note also in September, USDA increased corn for feed use for this marketing year by 50 million bushels to 5,275 million bushels (7.7% decline from the previous year), but still 440 million bushels less than the previous year.
What the numbers mean
These numbers indicate livestock folks must be losing money hand-over-fist and going out of business. So a little research into what USDA has recently reported about livestock numbers:
On the September 2022 Quarterly Pig Crop Report, USDA said market hog numbers were down 1% from a year ago (but up 2% from June 2022), and breeding stock numbers were down 1% from a year ago.
In October, USDA reported the number of cattle on feed were 1% less than a year ago and the number of fed cattle marketed in September were 4% above a year ago. Probably those 4% more cattle marketed ate 4% more corn than a year ago.
What do you think?
So, 1% fewer cattle and 1% fewer hogs certainly do not add up to a 7% to 8% decline in feed use. Therefore, the poultry business must truly be deep financial trouble.
Let’s check it out.
USDA reported in October that the number of layers laying eggs was 3% less than a year ago. That is a long way from 7 to 8%. USDA also reported that the number of layer type chicks hatched in September were 7% more than a year ago and 3% more layer type eggs were in the incubators. Gosh, the poor guys raising broilers must be in really bad shape.
Nope!
USDA said in October the number of broiler type eggs hatched in September were 5% more than a year ago and the number of broiler type eggs in incubators were up 4%.
The turkeys on feed are down 2% from a year ago.
There is no way a reasonable person can look at those animal numbers and conclude that corn for feed use will be down 7% this marketing year. Right now, it looks like a 2 to 4% increase in corn for feed use. That means we could see an increase in feed use this marketing year of 610 million bushels. That would reduce the U.S. corn carryover by more than 50% and take us down to a 15-day supply of corn on hand as of August 31.
That would be the tightest carryover in my lifetime and I am an old duffer.
Credit where credit is due
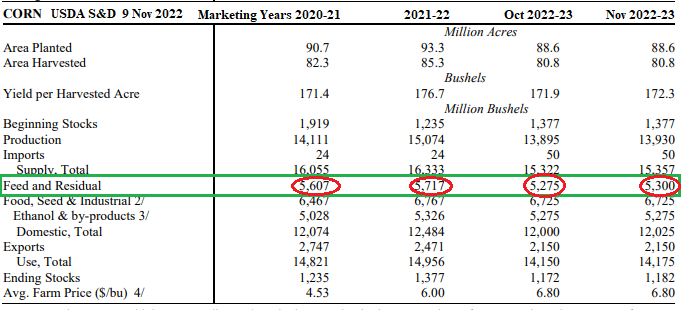
To give a little credit to USDA where credit is due, as you can see in the above S&D chart, USDA did increase feed use for this marketing year (2022-23) by 50 million bushels in October from September. And, as you can see below, USDA did increase corn feed use on Wednesday (November 9th) by 25 million bushels. So, if livestock numbers continue for nine more months about where they are now, we will see corn for feed use increase by another 500 or so million bushels.
Here is the corn USDA S&D issued November 2022:

It would be a good idea for you corn producers and corn users to keep a close eye on livestock numbers in the coming months. If you did not already know this feed use situation, then you need to make some changes in your market information gathering program.
Wright is an Ohio-based grain marketing consultant. Contact him at (937) 605-1061 or [email protected]. Read more insights at www.wrightonthemarket.com.
No one associated with Wright on the Market is a cash grain broker nor a futures market broker. All information presented is researched and believed to be true and correct, but nothing is 100% in this business.
The opinions of the author are not necessarily those of Farm Futures or Farm Progress.
About the Author(s)
You May Also Like


