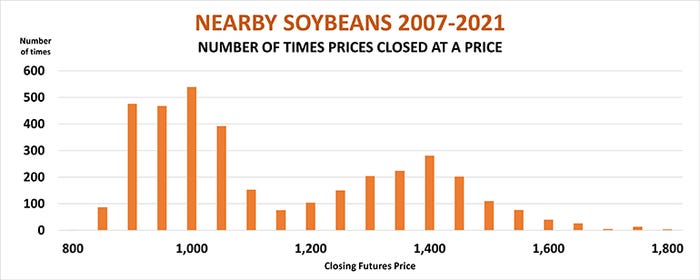
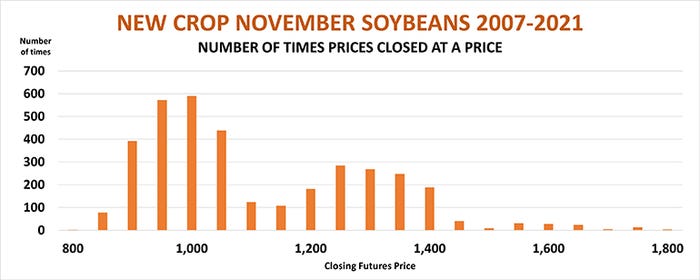
How good are soybean prices? Over the past 15 years, nearby futures closed over last week’s $15.64 high only 2% of the time. New crop November futures fared almost as well. The $14 high this week bettered than all but 4% of the closes since prices entered a new paradigm thanks to surging Chinese demand and South American production.
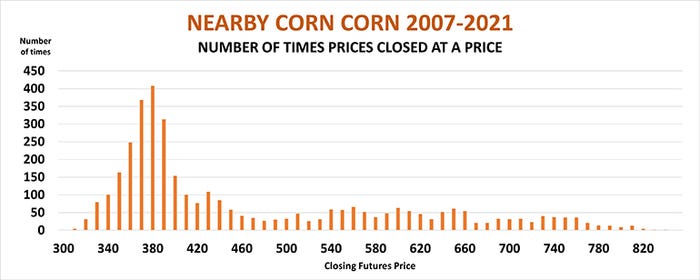
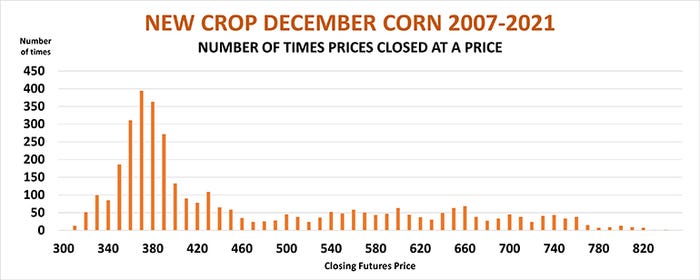
Corn didn’t perform quite as well, but was no slouch, either. Just 13% of the nearby futures closes since the start of the 2007 marketing year were better than last week’s $6.425 high. Only 12% of the closes in new crop December futures topped last week’s $5.8025 high.
So, whether you’re still wondering what to do with old crop inventory or considering new crop protection, it’s time to look down. Even though February reports on world supply and demand from USDA don’t normally move markets much, make sure your financial goals won’t be tarnished if the agency produces a surprise Feb. 9, or some other black swan event intervenes to disrupt the bull market.
Bullish price patterns
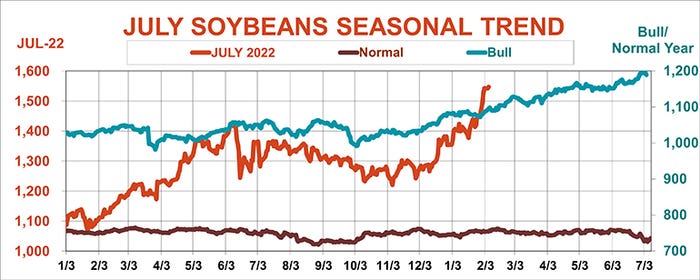
This doesn’t mean it’s necessarily time to sell 100% of what you own or intend to plant this spring. Despite hitting nosebleed territory, seasonal trends are working in soybean’s favor. Old crop July futures began March higher than they started February 54% of the time from 1974-2021. The biggest February gain came during the explosive 2007-2008 marketing year, when July jumped $2.26. November futures gained almost as much, $1.93, before the bottom dropped out of global markets in the wake of the financial crisis.
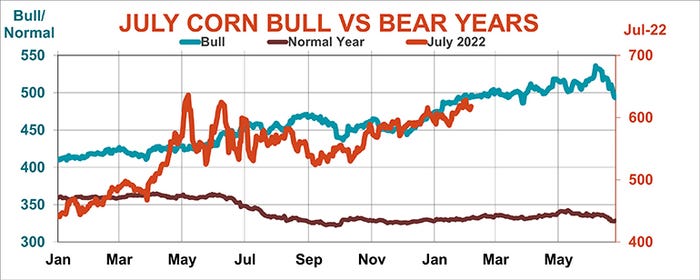
Old and new crop corn futures also gain in February, but the average increase is slight – just a penny or two. The best year for old crop was February 2011, when July gained 63 cents. December’s best, like soybeans, came in 2008, when December made a 57-cent move.
Both corn and soybeans are following the pattern seen in bullish years, when prices rallied during February, the opposite of the flat to weaker pattern during times of normal supply and demand. Soybean futures charts are clearly bullish, making new highs. December corn has also made new contract highs, though July remains below its May peak.
Follow the money
While South American weather remains the driving force behind this leg of the rallies for both crops, rising prices also feed into the story dominating talk on Wall Street: inflation. The Labor Department updates its Consumer Price Index Feb. 10, with investors fretting over the 7% reading from last month even before Friday’s stronger than expected jobs report.
Commodity prices are both a cause and effect of inflationary angst. The surge in crop prices over the past 18 months helped fuel inflation, and convinced some investors to pile into market for portfolio protection – and potential profits.
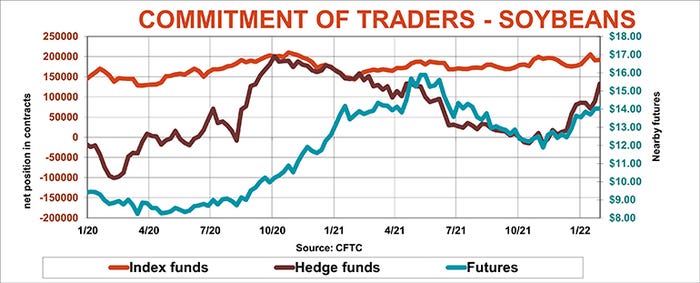
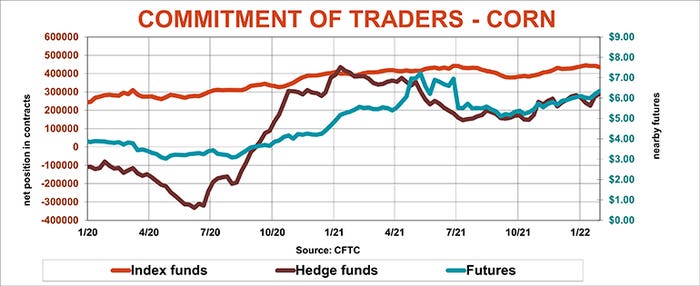
But Commitment of Traders released Friday’s by the Commodity Futures Trading Commission tell a more nuanced story. Large speculators, funds that are free to trade both sides of the market depending on whether they’re bullish or bearish, started selling soybeans seven months before last year’s market top. They began building their net long positions after harvest last fall. While their holdings are well below the 2021 peak, their buying correlated with 90% of the move in futures prices since. These funds led the charge last week, boosting their net long position by nearly 50%, buying more than $200 million worth of futures and options contracts.
The big specs started buying corn a bit earlier, after the Labor Day bottom, activity associated with 88% of the move in corn. Funds were only light buyers overall in corn last week.
But the data is mixed for another class of big players – those including pensions and institutional investors who use index funds to gain exposure to commodities. These funds take mostly long positions, and that buying was associated fairly well with the rally in corn. But there was little correlation with soybeans and the index funds. If index traders stay on the sidelines with beans it could place even more importance on the large speculative hedge funds to keep the rally moving.
Beware quiet markets
If all this volatility has your head spinning, take heart in another pattern from history. Years with big price ranges may be stomach-churning, but they’re better than the alternative. Range-bound trading may be quieter on the nerves; it also typically means lower prices.
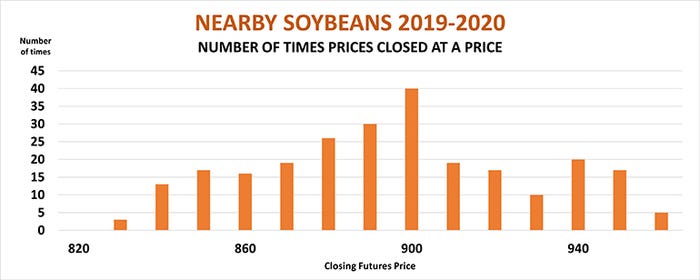
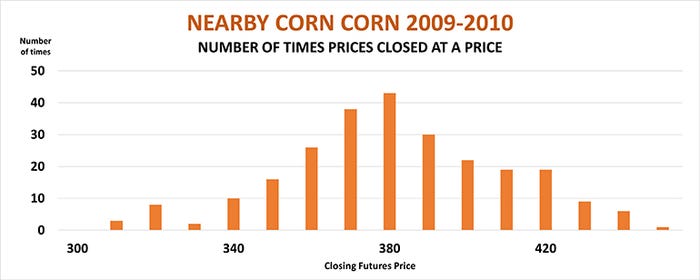
Price distributions for soybeans in the 2019-20 marketing year were smaller, and they resembled the ‘normal” bell curve from statistics. That is, most days of the year prices were close to the average, or mean, with so-called tails at the higher and lower ends of the range less frequent. This was also the pattern seen in 2009-10 corn.
So how did prices far in those years? Soybeans traded between $8.20 and $9.60, while corn was stuck in the $3 to $4.50 price range. Sure, prices were calm. They were also unprofitable.
Knorr writes from Chicago, Ill. Email him at [email protected]
The opinions of the author are not necessarily those of Farm Futures or Farm Progress.
About the Author(s)
You May Also Like


