February 23, 2024

Of all the months on the calendar, March shows the largest variation in climate from year to year.
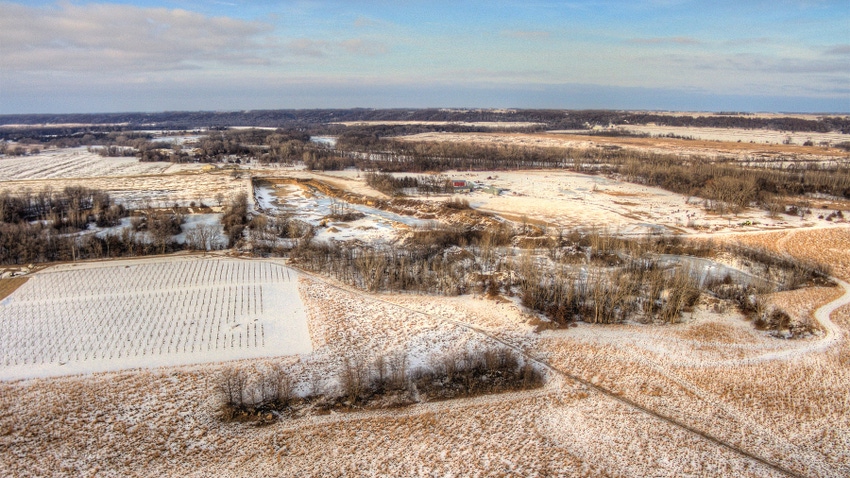
In winters with abundant snow cover, frigid temperatures can prevail, and soils remain frozen well into the month. Conversely, in winters with sparse snow, the sun’s energy more efficiently heats up the landscape, soils thaw, and in some cases, farmers can begin to prepare fields for planting — such as in 1910, 1977, 1987 and 2012.
Over the past 100 years, the long-term temperature change across Minnesota in March has been upward of 4 degrees F. March 2012 was the warmest in state history, with a statewide mean temperature of nearly 42 degrees, about 14 degrees above normal.
Many counties reported daytime high temperatures in the 70s and 80s that month. Over 40 counties reported temperatures of 80 degrees or higher March 17-19.
March 1899 was the coldest in the National Weather Service records for Minnesota, with a statewide average temperature of just 10.9 degrees, about 17 degrees colder than normal. Snow covered most of Minnesota that month, with the temperature dropping between 15 and 20 degrees below zero at night.
According to old Fort Snelling climate records, March 1843 brought 22 days with subzero temperatures. One final notable fact is that the all-time extreme temperatures for March range from 88 degrees at Montevideo in Chippewa County on March 23, 1910, to minus 50 degrees at Pokegama Dam in Itasca County on March 2, 1897.
Variable precipitation
Precipitation in March has been highly variable, too. A number of climate stations have reported virtually no precipitation during March, especially in 1910 in Caledonia, 1925 in Morris and 1967 in Luverne. Conversely, March 1977 was the wettest in state history, bringing 3 to 5 inches of rain to many areas of the state. Madison in Lac qui Parle County reported 7.25 inches that year, a statewide record amount.
Extremes for the state in March for snowfall range from zero to as much as 66 inches, which occurred in March 1965 at Collegeville in Stearns County.
Abundant snowfall in March is usually a precursor to spring flooding of many Minnesota rivers, especially when a wet April follows.
What about indications of a weather pattern for this March? El Niño episodes are correlated with warmer-than-normal months of March in Minnesota, but there is no correlation with the precipitation pattern in March.
More on Minnesota’s weather history is available in my book, Minnesota Weather Almanac, Second Edition, available at most bookstores or through the Minnesota Historical Society Press.
Read more about:
WeatherAbout the Author(s)
You May Also Like


