Grain prices were positioned higher Tuesday morning ahead of USDA’s highly anticipated quarterly grain stocks report, racing even higher immediately following the data dump. Corn prices soared nearly 4% within 15 minutes of the report’s release, with soybeans up more than 2% and most wheat contracts rising 1% to 2%.
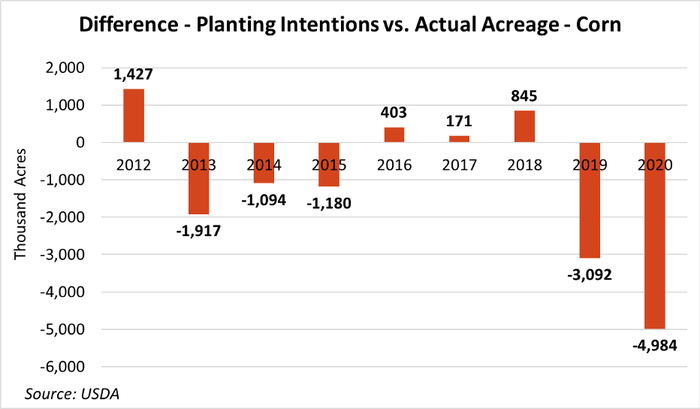
Corn acres came in much lower than expected in today’s acreage report from USDA at just above 92 million acres. Trade estimates had pegged the crop much higher after the March 31 Prospective Planting report indicated 97 million acres would be planted. Soybean acreage underperformed according to analyst estimates, coming in at 83.8 million acres, nearly a million lower than the trade expected.
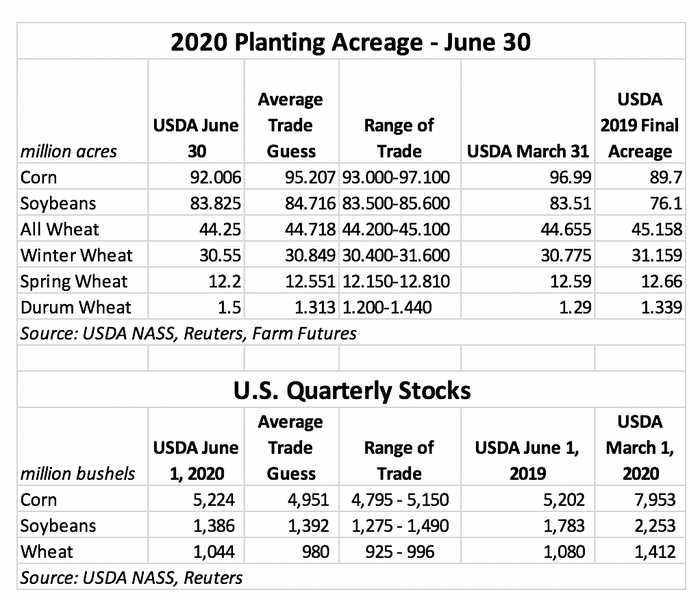
The agency’s corn acreage estimates came in at 92.006 million planted acres through June 1, although the agency concedes as much as 2.239 million more acres could be planted after that. Analysts expected a much more aggressive total, with an average trade guess of 95.207 million acres. Harvested acres are now anticipated to reach 84.023 million acres – still favorable compared to 2019’s rough result of 81.322 million acres.
“With 5 million fewer acres of corn planted this spring, production estimates will trend closer to 15.2 billion bushels this fall if trendline yields hold true,” according to Farm Futures grain market analyst Jacquie Holland. “That tightens the new crop carryout by nearly 1 billion bushels, easing ending stocks back from 3.3 billion bushels to about 2.5 billion bushels.”
USDA’s estimate was much lower than markets expected – the lowest trade guess was 93.0 million acres, Holland points out: “But 92 million acres seemed to do the trick for bearish corn prices as December futures soared as much as $0.19/bushel higher at one point on the news.”
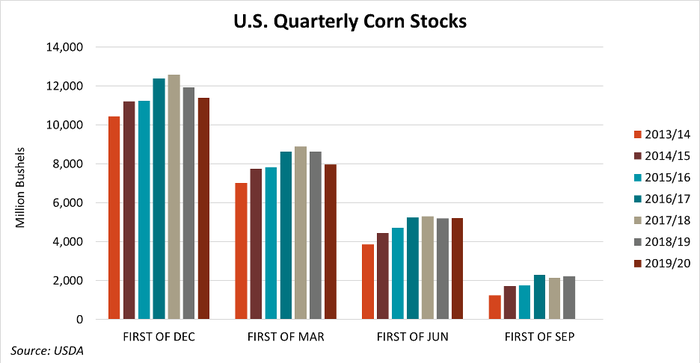
USDA reports corn stocks at 5.22 billion bushels, which is 1% above the same time last year. Analysts were expecting a slight decline, with an average trade guess of 4.951 billion bushels. Of the total, on-farm storage accounted for 3.03 billion bushels, which is 3% higher than a year ago. In contrast, off-farm storage is down 2% year-over-year, sliding to 2.20 billion bushels.
Corn disappearance was significant, dropping 2.73 billion bushels between March and May but couldn’t hold pace with last spring, when disappearance reached 3.41 billion bushels.
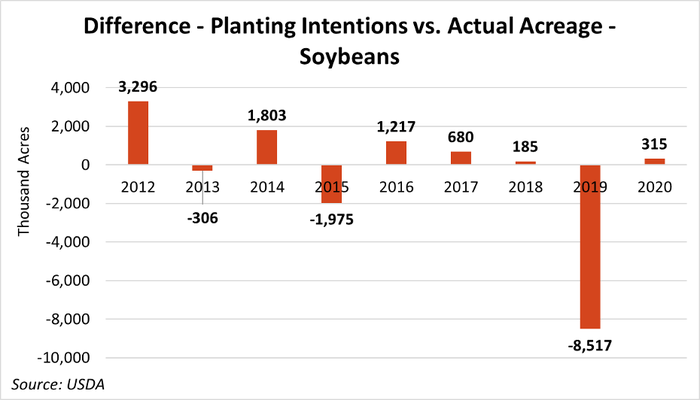
Soybean acreage also tumbled below analyst estimates, falling to 83.825 million acres through the end of May, although that is still above USDA’s March estimates of 83.510 million acres. The agency expects another 12.101 million acres to make it in the ground after June 1. Total harvested acres this fall could still move more than 8 million acres above last year’s tally, with expectations now at 83.020 million acres.
“Soybean acres also surprised markets with a low figure,” Holland says. “High soybean futures prices during planting relative to corn acres along with a rocky spring wheat planting season in North Dakota suggested there would be a lot of movement to soybeans in today’s report. But that clearly wasn’t the case as only 83.8 million acres were planted this year, just shy of the lowest analyst guess.”
Provided trend yields of 49.8 bushels per acre are realized this fall, that acreage would result in a 4.1-billion-bushel soybean harvest, Holland adds.
“The increased acreage would add an extra day of carryout to ending stocks, but at 411 million bushels, the new crop ending stocks would still remain tight relative to record demand, especially if exports pick up this fall,” she says.
Soybean stocks tumbled 22% year-over-year to 1.39 billion bushels. That was very close to analyst expectations, with an average trade guess of 1.392 billion bushels. On-farm storage dropped 13% to 633 million bushels, while off-farm storage dropped 28% to 753 million bushels.
Soybean disappearance was down 8% from a year ago, losing 869 million bushels between March and May.
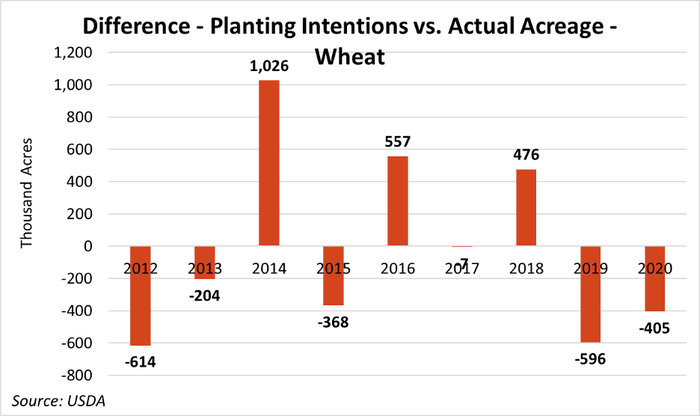
All wheat plantings are about 500,000 below trade expectations, with USDA now marking this year’s crop footprint at 44.250 million acres. That number is also below the agency’s March estimates of 44.655 million acres and a final 2019 tally of 45.158 million acres.
“Wheat prices received a boost on lower than expected spring wheat plantings as the total wheat acreage planted in 2020 notched another record low,” Holland says.
Old crop wheat storage is now at 1.04 billion bushels, which is 3% lower compared to a year ago. Analysts expected that number to slip to 980 million bushels, however. On-farm storage is up 12% from 2019, at 232 million bushels. Off-farm stocks, meantime, slipped 7% lower compared to last year, at 812 million bushels.
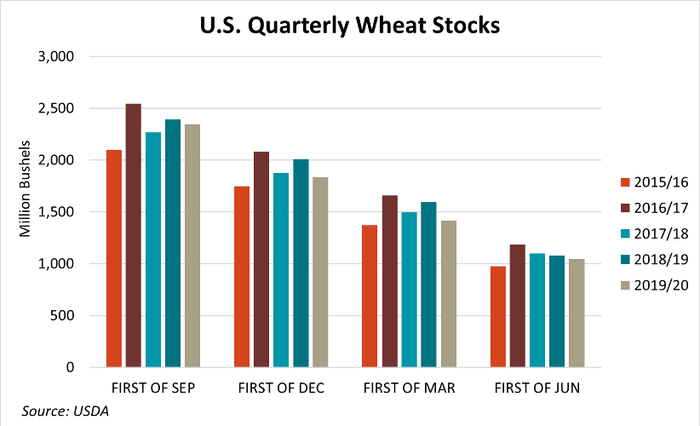
Wheat disappearance between March and May reached 372 million bushels, which is 28% lower compared to the same period in 2019.
About the Author(s)
You May Also Like


