Subscribe to receive top agriculture news
Be informed daily with these free e-newsletters

November 6, 2012
For farmers taking revenue crop insurance, the lowest possible revenues for 2013 largely will be determined when projected prices for crop insurance are set of the end of February 2013. Currently, Chicago Mercantile Exchange (CME) futures contract used to set projected prices are near $6.35 for corn and $13.40 for soybeans. Herein, projected prices of these levels are placed in historical context. Then, historical changes in futures prices from December to February are examined to quantify downside risk to futures prices between now and February.
Historical projected prices
A $6.35 projected price for corn would be the highest projected price in history, 6% higher than the next highest price of $6.01 in 2011. The 2012 protected price was $5.68, meaning that a $6.35 projected price would be 12% than the 2012 price. Given a $6.35 price, per acre insurance guarantees would be historically high for the same coverage levels. Insurance premiums likely will be higher as well, as higher projected prices lead to higher insurance premiums.
A $13.40 projected price for soybeans would be the second highest projected price. The highest projected price was $13.41 in 2011. The 2012 projected price was $12.55, meaning that a $13.40 projected price would be 6 percent higher than then 2012 projected price. While not the highest, a $13.40 projected price would provide relatively high per acre insurance guarantees. Similar to corn, higher projected prices increase insurance premiums.
Historical changes in harvest time contracts
CME futures prices could change between now and the February period in which settlement prices are set. To quantify potential price changes, settlement prices on the December corn contract and November soybean contract were collected. Then, settlement prices for the December prior to harvest and February were averaged, and a price change was calculated. A -10% price change would mean that the February price was 10% lower than the December price. If a similar 10% price decline occurred, the $6.35 futures price would decline to $5.72 ($6.35 x (1 - .1 decline).
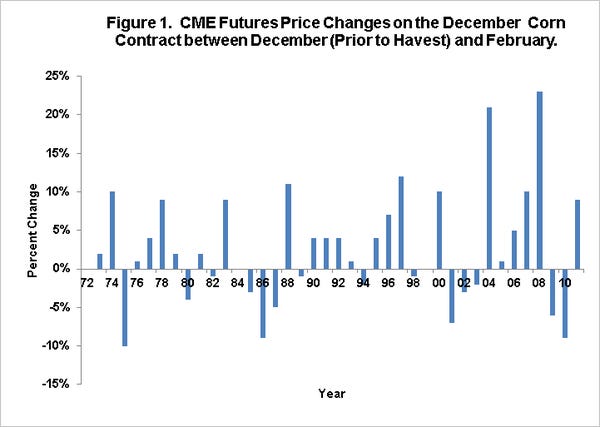
Figure 1 shows price change between December prior to harvest and February for the December corn contract for 1972 through 2011. The largest price decline occurred in 1975 when the price change was -10%. An -10% price change would cause the $6.35 corn price to decline to $5.72. The next largest price declines were -9% (results in a $5.78 price), -7% ($5.91 price), -6% (5.97 price), and -5% ($6.03 price). While large price declines are possible, most years have modest price changes or price increases. Historical changes suggest that there is a much larger chance that prices will be above $6.00 than below $6.00.
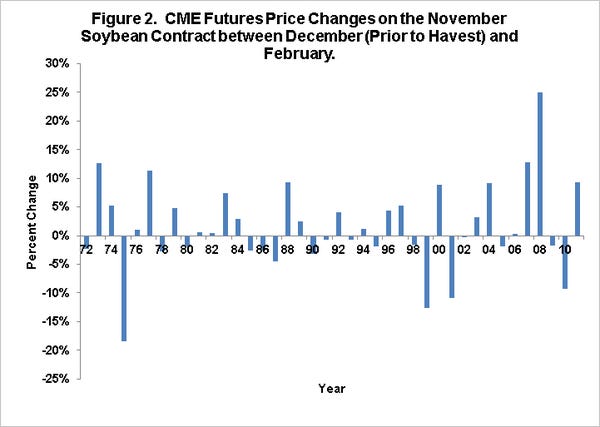
Figure 2 shows price changes for the November soybean contract. The largest price decline of -18% occurred in 1976. An -18% price changes would cause the $13.40 soybean price to decline to $10.99. Other large price declines were -13% ($11.66 price), -11% ($11.93 price), -9% (12.19 price), and -4% (12.86 price). While large price declines have happened, historical data suggests the 2013 projected price will most likely be above $12.75.
Summary
The 2013 projected prices for corn and soybeans likely will be near historically high levels, providing farmers will have the ability to set relatively high per acre guarantees using crop insurance. These are possibilities for falling prices, particularly for soybeans. However, historical changes suggest projected prices will most likely be at high levels.
You May Also Like
Enter a zip code to see the weather conditions for a different location.