October 13, 2021

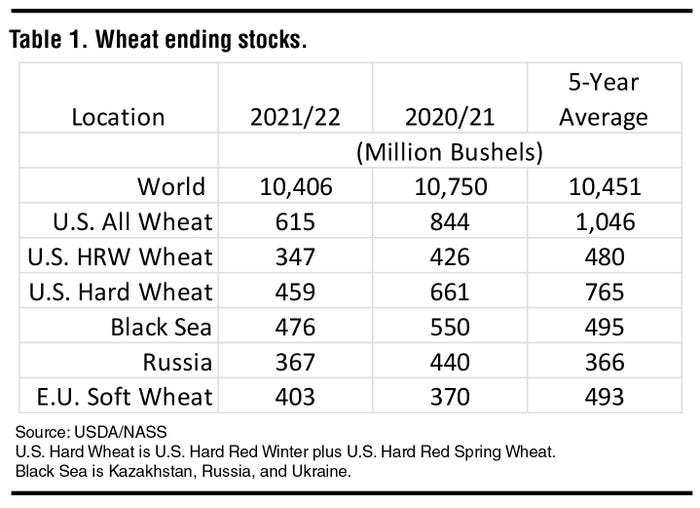
About 90% of the 2021/22 world wheat crop has been harvested, and the 2021/22 wheat marketing-year stocks are considered tight. The 2021/22 world wheat ending stocks are projected to be 10.41 billion bushels (Table 1). The world 2019/20 marketing-year wheat ending stocks were a record 10.935 billion bushels.

The U.S. average 2019/20 wheat marketing year price was $4.58. During the 2021/22 marketing year, U.S. wheat prices are projected to average $6.60. At this writing, the Medford, Oklahoma, wheat price is $7.22. Wheat may be forward contracted for 2022 harvest delivery for $7.22.
During the last 10 years (June 2011—May 2021), Medford wheat prices have averaged $5.33. The highest price was $9.03 (Feb 9, 2011), and the lowest price was $2.55 (Aug. 30, 2016).
When comparing wheat ending stocks to historical levels, it is important to note that there have been changes in the world wheat marketing system. One major change is going from a “just in time” to a “just in case” grain supply philosophy. Both major exporters and importers have increased target wheat stock levels.
Significantly higher ocean freight rates (100% increases in some cases plus problems scheduling vessels) support the desire to maintain higher wheat stocks.
To increase wheat stocks and potentially manage bread prices, Russia implemented a wheat export tax. The tax is equivalent to 75% of the average Black Sea export price above $200 per metric ton. The most recent reported tax was $55.30 per metric ton ($1.50/bu.).
This action implies (even though Russia’s 5-year average ending stocks were 366 million bushels) that Russia’s projected 367-million-bushel 2021/22 marketing year ending stocks projection is considered tight. Russia’s 2020/21 wheat ending stocks totaled 440 million bushels.
Side note: Russia’s tight wheat stocks may be deceiving. Russia’s 2021 wheat production is projected to be 2.664 billion bushels compared to 3.167 billion last year. However, 87.5% of the 2021 wheat crop is 4th class (minimum 11% protein and 18% wet gluten) compared to only 71.7% last year. This change implies that there are 2.331 (2.664 x 0.875) billion bushels of flour milling wheat this year compared to 2.270 (3.167 x 0.717) billion bushels last year.
See, COTTON SPIN: What to do with dollar cotton?
Black Sea wheat 2021/22 wheat ending stocks are projected to be 476 million bushels compared to 550 million bushels last year and a 5-year average of 495 million bushels.
Note that Black Sea wheat exporting countries normally maintain tight wheat stocks. The five-year average wheat stocks-to-use ratio (ending stocks ÷ total use) is 11% compared to the world’s average of 34% and a U.S. wheat stocks-to-use average ratio of 43%.
Any way you look at it, U.S. wheat stocks are tight (Table 1). All U.S. 2021/22 wheat ending stocks are projected to be 615 million bushels compared to a five-year average of 1.046 billion bushels.
U.S. hard red winter wheat 2021/22 ending stocks are projected to be 347 million bushels compared to a five-year average of 480 million bushels. The 2021/22 wheat marketing-year U.S. hard red wheat (hard red winter plus hard red spring wheat) ending stocks are projected to be 459 million bushels compared to a five-year average of 765 million bushels.
Since about 90% of the world’s 2021/22 wheat marketing year production has been harvested, the tight hard red wheat situation is expected to last through the August-September 2022 time period.
Wheat stocks are relatively tight, and prices are expected to remain relatively high.
About the Author(s)
You May Also Like


