February 3, 2020

Research indicates that the best price predictor may be the current price. At this writing, the Medford Oklahoma harvest delivery forward contract wheat price is $4.72. This price is based on the KC July wheat contract price minus a 20-cent basis. The forward contract price for Perryton Texas is $4.62, which is based on the KC July wheat contract price and a minus 30-cent basis.
The one thing known with almost 100% certainty is that the Oklahoma and Texas wheat harvest prices will not be $4.72 (Oklahoma) or $4.62 (Texas). Economic theory suggests that there is a 50% chance that wheat prices will be above $4.72 ($4.62) and a 50% chance that prices will be below $4.72 ($4.62). However, current wheat stocks projections indicate higher upside price potential than downside price risk.
The 10-year average (June 2009 through May 2019) Oklahoma wheat price is $5.51, and the Texas average wheat price for that period is $5.54. The 10-year average Medford Oklahoma wheat price is $5.51, which matches the USDA/NASS’s reported Oklahoma’s 10-year average price. (Oklahoma’s 2009 through 2019 June wheat prices averaged $5.64. The July average was $5.67.)
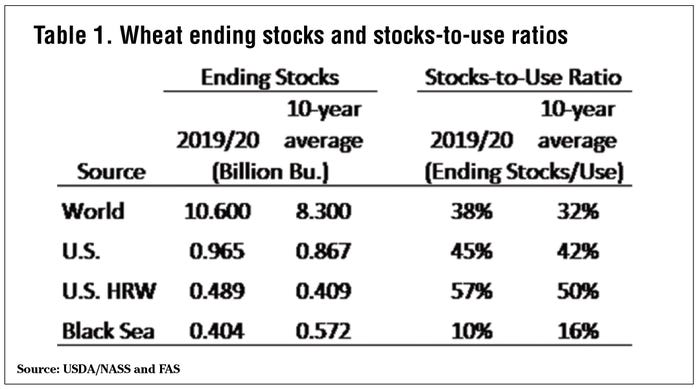
USDA’s World Agricultural Supply and Demand Estimates projects that on June 1, 2020, world wheat stocks will be 10.6 billion bushels compared to a 10-year average of 8.3 billion bushels (+20%) (Table 1). The world’s wheat stocks-to-use ratio is projected to be38 % compared to a 10-year average of 32% (+19%).
United States wheat ending stocks are projected to be 965 million bushels compared to a 10-year average of 867 million bushels (+11%). The stocks-to-use ratio is projected to be 45% compared to the 10-year average of 42% (+7%).
United States Hard Red Winter (HRW) wheat ending stocks are projected to be 489 million bushels compared to the 10-year average of 409 million bushels (+20%). The stocks-to-use ratio is projected to be 57% compared to a 10-year average of 50% (+14%).
World and U.S. wheat ending stocks and stock-to-use ratios are above average and indicate a below-average wheat price ($4.72 versus $5.51).
A caveat is that the Black Sea exporters (Russia, Ukraine, and Kazakhstan) have a major impact on U.S. and world wheat prices. Black Sea wheat ending stocks are projected to be 404 million bushels compared to a 10-year average of 572 million bushels (-29%). The Black Sea wheat stocks-to-use ratio is projected to be 10% compared to a 10-year average of 16% (-38%).
The Black Sea stocks-to-use ratio indicates that on July 1 (the start of the Black Sea wheat marketing year), the Black Sea countries will only have about 36 days of wheat in the bin. Any delay in the harvest or below-average production could result in Oklahoma/Texas wheat prices being significantly higher than $4.72.
Another unknown is how much of the 489 million bushels of U.S. HRW wheat ending stocks is milling quality wheat. The odds are that a relatively high percentage of the ending stocks should go to the feed market instead of the flour mill.
Using the high and low prices from the last 10 years, prices could reach $9.06 or decline to $2.55 during the 2020/21 wheat marketing year. However, the June 2020 wheat price range is probably between $4.00 and $6.00.
The above estimates indicate that the current forward contract price of $4.72 ($4.62) is in line with the world and U.S. ending stocks and stocks-to-use ratio projections. The Black Sea projections also substantiate the indication that prices may have more upside potential than downside risk.
Table 1. Wheat ending stocks and stocks-to-use ratios.

About the Author(s)
You May Also Like


