May 11, 2017
By Scott Irwin, Todd Hubbs and Darrel Good, University of Illinois
Very high U.S average soybean yields that were well above the long-term linear trend values (calculated beginning in 1960) in each of the last three years continues to be somewhat of a puzzle in search of an explanation. One potential explanation for yields being so much higher than the long-term linear trend values is that there has been a shift (higher) in the linear trend in U.S. average yields in recent years. However, we have not yet been able to identify a shift in that trend due to the limited number of observations. A second potential explanation is that yields have actually followed a non-linear rather than a linear trend. In fact, we found in a recent article (farmdoc daily, April 19, 2017) that a quadratic equation does provide a slightly better fit to U.S. average yields from 1960 through 2016 than does a linear equation. That is, yields appear to have actually increased at an increasing rate over the last several years rather than at a constant rate (in bushel terms). Based on the quadratic trend values for the past three years, only 2016 represented an unusually large positive deviation between actual and trend yields. The question, then, is what are the factors that have contributed to a better fit for a non-linear trend to average soybean yields?
In the farmdoc daily article of April 19, 2017 we examined long-term soybean yield trends by state. We concluded that a linear trend is the best fit to actual yields for many states in the U.S. However, a quadratic trend provided a better fit than a linear trend for a number of states. Those states included Nebraska and all states in the Delta and Southeastern portion of the U.S. It appears, then that the non-linear trend for U.S. yields is driven by non-linear trends in selected states. It is interesting to observe that some of the states that have experienced yields rising at an increasing rate in recent years are also states that have a higher proportion of irrigated soybeans. This raises the question of whether yields for irrigated soybeans have exhibited trend yield performance that differs from trend yields for non-irrigated soybeans, which in turn might explain the non-linearity in U.S. yield trends. Here, we examine the long-term yield performance separately for irrigated and non-irrigated soybean production in the U.S. to determine if trends have in fact differed.
Analysis
We start with an examination of trends in the magnitude of irrigated acreage of soybeans in the U.S. since 1960. Figure 1 shows the harvested acreage of irrigated and non-irrigated soybeans from 1960 through 2016. Irrigated acreage is obviously still a small proportion of total acreage even though irrigated acreage has increased from essentially zero in 1960 to about 5.5 million acres in recent years. As indicated in Figure 2, irrigated acreage has ranged between six and seven percent of total harvested acreage since 2000. Production on irrigated acreage has accounted for 6.5 to 8.5 percent of total production, reflecting the generally higher average yields on irrigated acreage. Previous to the late 1990s, irrigated acreage and production shares tracked one another quite closely. There is a notable jump in the production share compared to the acreage share around 2000. As shown in Figure 3, irrigated soybean acreage is concentrated in two states, Arkansas and Nebraska, with acreage at about 2.5 million in each state in recent years.
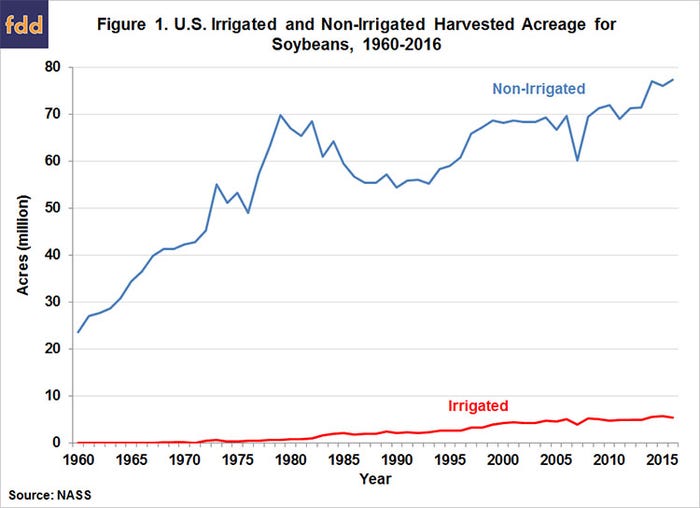
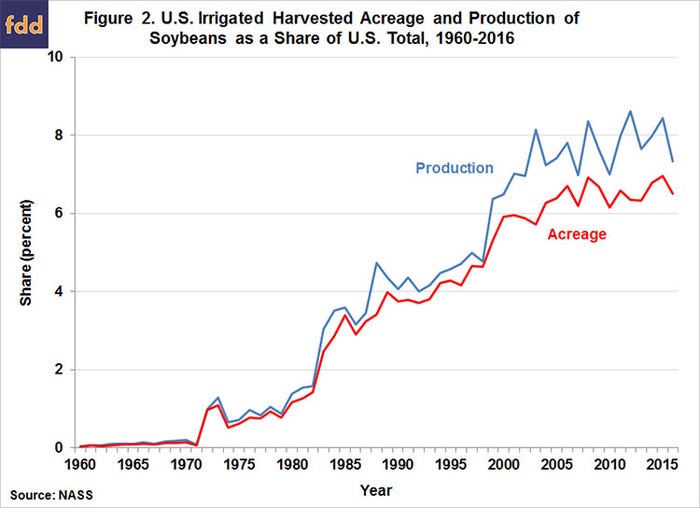
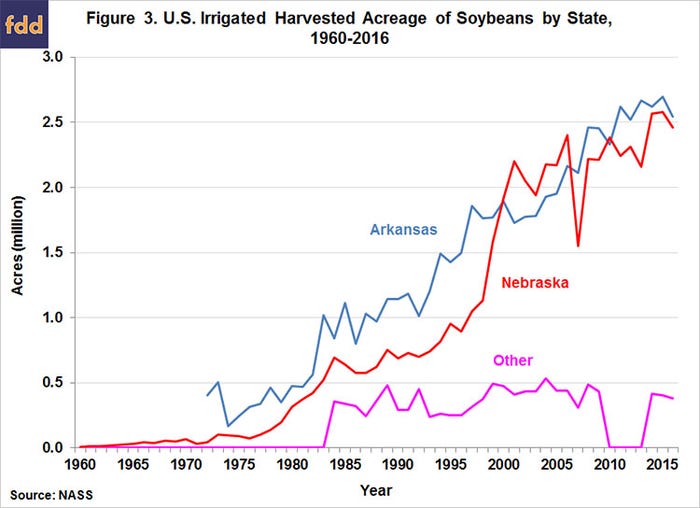
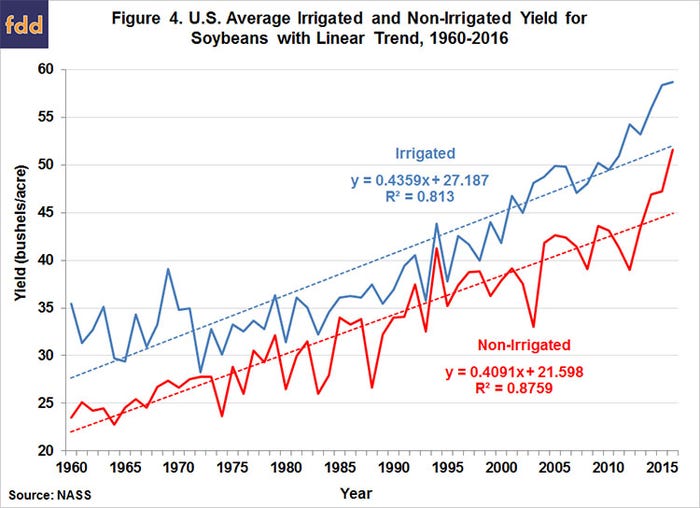
Figure 4 presents the history of average yields for irrigated and non-irrigated soybean acreage from 1960 through 2016 with a linear trend fit to the yield data. Several observations can be made. First, and as expected, average yields are higher on irrigated than on non-irrigated acreage. Second, the linear trends fit to the yield observations indicate that yields have increased at a slightly faster rate on irrigated than on non-irrigated acreage (0.44 bushels per year versus 0.41 bushels per year) Third, the linear trend fits the non-irrigated yield observations better than the irrigated yield observations (R2 of 0.88 versus 0.81). Fourth, average yields have been above the linear trend for three consecutive years for non-irrigated production and eight consecutive years for irrigated production.
Next, we fit a quadratic trend to the yield observations for irrigated and non-irrigated production in Figure 5. Again, several observations can be made. First, the quadratic trend fits the yield observations much better than the linear trend for irrigated production (R2 of 0.93 versus 0.81). Second, the quadratic trend provides a similar fit to that of the linear trend for non-irrigated production (R2 of 0.89 versus 0.88). Third, the quadratic term in each regression is statistically significant, which indicates that the non-linear curvature of the trend regressions is unlikely to be due to random chance. Fourth, the rate of increase in yields for irrigated production in recent years is much higher than the rate of increase in non-irrigated production. In particular, the rate of growth in irrigated trend yields over the last decade has averaged 1 bushel compared to 0.6 bushels for non-irrigated trend yields. This also helps explain why the irrigated production share jumped in the last decade compared to the irrigated acreage share (Figure 2). Fifth, the difference between actual and the quadratic trend value is relatively small for irrigated production for the past two years. The difference is large only in 2016 for non-irrigated production.
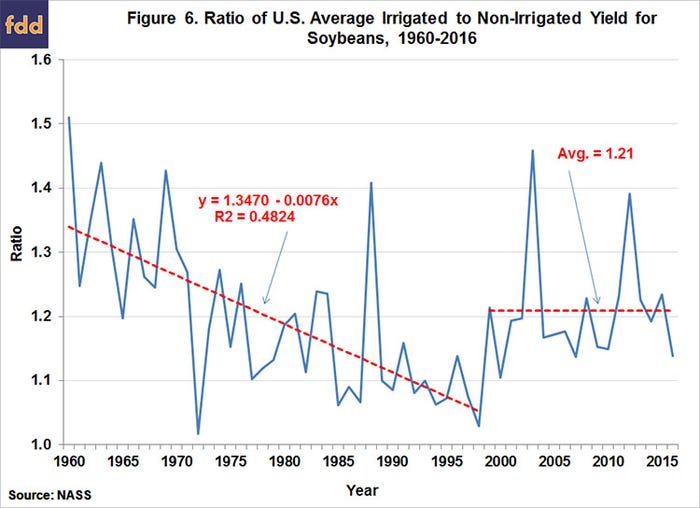
We can conclude from the analysis in Figure 5 that the non-linear growth rate for irrigated soybean yields has contributed to the non-linear growth in average U.S. soybean yields. This is further illustrated in Figure 6, which shows the ratio of average irrigated to non-irrigated yields. This ratio declined steadily from about 1.5 in 1960 to just above 1.0 in 1998, reflecting the gain in non-irrigated soybean yields relative to irrigated yields. Then around 2000 the ratio suddenly increased again and stabilized around an average of 1.21. The ratio has not been below 1.1 since 1999.
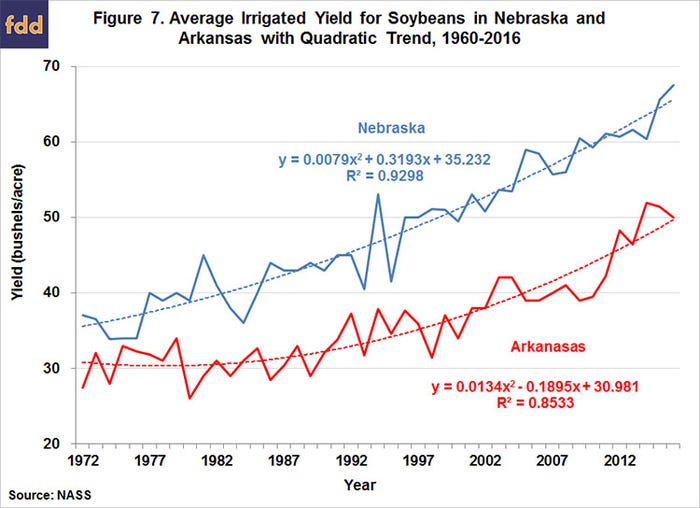
Since the majority of the irrigated soybean acreage is in Nebraska and Arkansas, we examine in Figure 7 yield trends in each of those states. Average yields are higher and less variable in Nebraska than in Arkansas. The quadratic trend explains 93 percent of the variation in annual yields in Nebraska and 85 percent in Arkansas. There is a notable surge in irrigated soybean yields in Arkansas in the last decade that is not observed in Nebraska. Consequently, average yields for irrigated production have been increasing at a faster rate in Arkansas than in Nebraska in recent years. This also means that yields on irrigated acreage in Arkansas are contributing more to the non-linear growth in overall U.S. average yields than are irrigated yields in Nebraska.
Implications
We have historically argued that a linear trend beginning in 1960 provided the best fit to actual U.S. soybean yields and that conclusion appears valid through 2013. The high yields in 2014, 2015, and especially 2016, suggest that yields are actually increasing in a non-linear fashion. A quadratic trend does provide a slightly better fit to actual U.S. average yields since 1960 than does a linear trend. That is, yields appear to be increasing at an increasing rate in recent years. Our previous analysis (farmdoc daily, April 19, 2017) indicated that the non-linearity in U.S. average yields is being driven by yield growth in Nebraska, the Delta, and the Southeast. One possibility is that yield growth in these areas is being driven by yield increases for irrigated production. We find that yields on irrigated production have in fact been increasing at a faster rate than for non-irrigated production. The growth has been especially strong in Arkansas. This means that yields on irrigated acreage are contributing to the non-linear growth in overall U.S. average yields.
A remaining question is whether the increase in yields for irrigated production is the full story behind the increasing yield in the Southeastern U.S. growing region. We will pursue that issue next week when we examine the trends in yields for irrigated and non-irrigated production in the Southeast compared to the rest of the country.
References
Hubbs, T., S. Irwin, and D. Good. "Will the Shift in Soybean Acreage Impact National Yield in 2017? A State-Level Trend Analysis." farmdoc daily (7):72, Department of Agricultural and Consumer Economics, University of Illinois at Urbana-Champaign, April 19, 2017.
You May Also Like


