When markets crash, they often crash hard. Gains that take painstaking weeks to build can evaporate in a flash. That was the path December corn futures followed this summer, when the 11-week April-to-June rally lost much of its move in just five trading sessions.
The collapse was the start of the downturn that cut the price of corn by 30% by the time August lows were made. But it was a perfect proving ground for evaluating
the performance of chart-based signals we discussed in our May coverage (“Timing the market: Beating the odds may be impossible, but many try”).
Here’s how the signals worked:
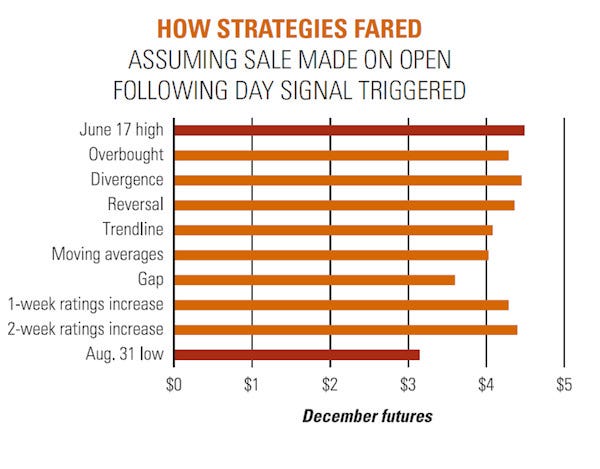
Overbought. Sharp rallies can take markets to overbought status on momentum indicators, such as the Relative Strength Index, or RSI. Our tipping point was a move above 70%, which happened on June 6, just after the June 1 starting point for our study. That triggered a sale on the following day’s open at $4.2875. Though the market stayed overbought for most of the next two weeks, the signal worked well at initiating a sale.
Divergence. Markets that make new highs but fail to take out previous highs on a momentum indicator like the RSI are said to show divergence. This happened on June 14, and December opened at $4.4525 the next day, just a few cents from the top of the rally.
Reversals. That next day, June 15, futures made a new high for the rally, but closed lower, a pattern known as a reversal. December opened the next session at $4.36.
Trendlines. As often happens, prices rejected the reversal initially, hitting $4.49 on June 17. Two days later futures broke below the trendline drawn off previous May and June lows that held the rally together for six weeks. But violation of the line triggered aggressive liquidation by bulls, sending futures down by their daily trading limit of 25 cents. December opened the next session at $4.0825.
Moving averages. One of the simplest indicators takes the average of prices over a time period, with sales triggered after futures close below the average. The limit-down trade on June 21 also broke the 25-day moving average. After opening at $4.0825 the next session, prices closed at $4.04, below the 50-day moving average, leaving the market to start trading June 22 at $4.0275.
Gaps. After a brief attempt at a rebound, the market again headed lower into the Independence Day weekend. As sometimes happens after a holiday, prices gapped lower on the start of trading July 5, with the daily high never getting back to the previous sessions’ low. The gap was another signal we discussed. Prices open the next session at $3.60.
Our May story also discussed weekly crop ratings. Ratings went up both June 6 and 13, putting the crop in very good shape. Sales made on the open June 7 would have netted around $4.2875, with those on June 14 at $4.395.
The prices collected by these eight sales averaged $4.187. That was around 30 cents from the top of the market, but more than a dollar off the August low and in the top 25% of the price range for the summer.
Of course, these sales were all hypothetical. We didn’t actually sell any corn. And just because a method seemed to work this summer, that doesn’t mean it will work every year. But using signals like these are one way to bring discipline to a marketing plan — something that can be hard to find in the heat of a rally.

- Decision Time: Risk Management is independently produced by Farm Futures and brought to you through the support of Case IH.
About the Author(s)
You May Also Like


