Subscribe to receive top agriculture news
Be informed daily with these free e-newsletters

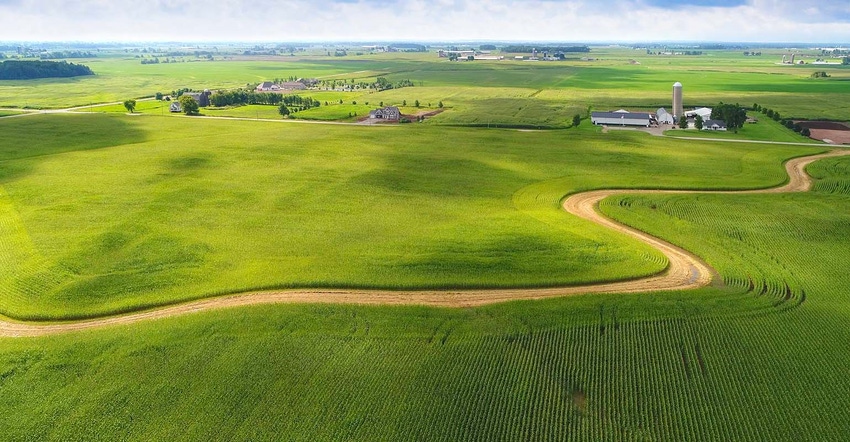
Despite poor grain prices, land values could go either way. Here’s 9 trends to watch.
If you ever want to ask someone involved in agriculture a trick question, ask them about land values. In a market where every sign should lead land values lower, we’re just simply not there.
Not yet, anyway.
Land values lost 15% to 25% of their value since their peak around 2014, says F. Howard Halderman, speaking at a recent Chicago Ag Club meeting in Chicago. Prices have since stabilized adds Halderman, who does management, appraisals and land sales at Halderman Real Estate and Farm Management out of Wabash, Ind.

“The majority of buyers are farmers, based on our sales - 75% when all stats are put in,” says farmland realtor Howard Halderman.
Farm incomes, interest rates, and supply will impact near-term land values most. Real net farm income will be at historically low levels this year, with projected gross income in the $700-$750 per acre range for corn, which may be below cost of production for many farmers.
However, land values are propped up right now due to low supply. According to Farm Credit Services of America, farmland sales have declined five years in a row. When prices begin to fall, owners hold off, hoping for better times. And, there have been few forced sales due to financial trouble. So, there’s a low supply of land for sale right now.

Here are some other signs to watch:
Right now there are few outside drivers. For example, landowners scrambled to sell assets in 2012 when they anticipated change in the capital gains tax rate. “The threat of capital gains tax increases pushed a lot of people to get out of farmland in 2012,” says Halderman. Other outside drivers include interest rates. When interest rates were near zero, as they have been for a decade, owners saw few better places to deploy capital. Now that interest rates are creeping higher some owners may see a 2.5% Certificate of Deposit as a better option than land.
Use WAPI to track land value trends. One way Halderman tracks real estate sale trends is to analyze the land using the weighted average productivity index (WAPI) compared to the sale price per acre. The WAPI is a summary of the soil types on a farm and the corresponding productivity index as provided by the USDA and NRCS. This analysis is done by dividing the price per tillable acre by the WAPI. For example, if a farm sells for $7,500 per acre and the WAPI is 145, the result is $51.72 per WAPI point.
Looking at Indiana land values at their peak in 2013, WAPI came in around $62. By 2015 the number declined to below $50 and is now trending in the high 40s.
Who are the buyers? There are some institutional land buyers, but not as many as you think. “The majority of buyers are farmers, based on our sales - 75% when all stats are put in,” he says. “When the ethanol boom was new in 2008, 85% of buyers were farmers, because investors hadn’t caught on yet.”
How will tariffs impact land values? When tariffs went into play, the Brazilian basis jumped 250 points to the positive while New Orleans basis declined. Still, tariffs alone won’t impact land values directly. China will still buy U.S. soybeans. Other factors, like a large expected carryover depressing prices, will have a bigger impact on land. Despite huge corn yields, world corn stocks are declining.
Watch ‘no sale’ trends. When owners want to sell at public auction but don’t get their minimum price, it results in a ‘no sale.’ Based on Farm Credit Services of America statistics, in 2012 the number of “no-sales” was 2.2% based on 5,925 sales; in 2017 that number had grown to 4.1% based on 3,334 sales.
Watch ratios for signs of stress. U.S. farm real estate debt peaked at over $200 billion in the early 1980s. It then fell and has remained just over $100 billion the last several years, reflecting farmer reluctance to take on too much debt. It began creeping higher starting in 2010 and passed $200 billion in 2017. Both debt-to-asset and debt-to-equity ratios peaked in 1985 and have since fallen significantly. However, debt-to-income ratios are now edging higher, reflecting tight margins. “When debt to income ratio gets above 5% it’s concerning,” says Halderman. “It went up to 6.5% in 2018.”
Crop borrowing costs are higher. Long-term, a loan is still cheap at today’s 5.6% interest rates, but that’s still higher than five years ago. And there’s no sign those rates are coming down any time soon.
Higher delinquency rates could lead to forced land sales. Delinquency rates for farm loans remain low historically speaking. However, the Kansas City Federal Reserve says repayment rates are the lowest since 1985, reflecting financial stress in farm country. If operators run out of cash and bankers require some asset sales to replenish cash, more land will be coming up for sale.
Recreational, farmhouse values are higher. That’s to be expected, thanks to a better general economy.
The opinions of the author are not necessarily those of Farm Futures or Farm Progress.
You May Also Like
Enter a zip code to see the weather conditions for a different location.