Spring is often when farmers and landowners begin checking custom rates for hired tasks. As American Agriculturist has reported in the past, those numbers aren’t easy to come by.
Pennsylvania’s custom rate survey wasn’t conducted this year, due to state ag department budget cuts. See the end of this story for how to access the 2016 Pennsylvania machinery custom rates.
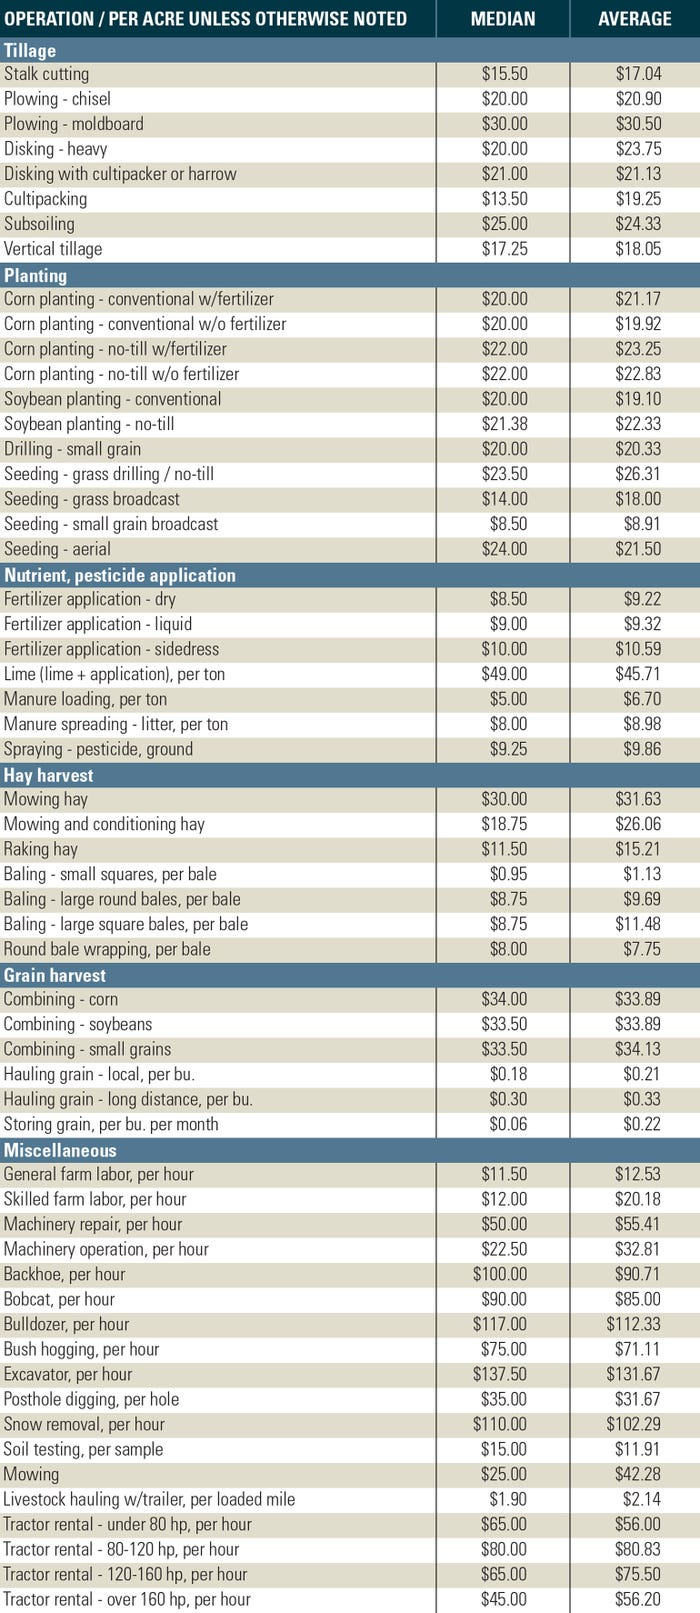
The accompanying custom work charges come from University of Maryland Extension’s 2017 survey. For your convenience, the accompanying chart categorizes charges as average and median values tabulated from 40 custom operators and farmers. The survey, conducted every two years, was headed by Shannon Dill, University of Maryland Extension educator.
Due to the smaller number of responses, tasks with two or less responses were dropped from the accompanying table. As with any survey, the more responses, the more reliable are the numbers. In 2015, rates were collected from 77 cooperators.
Charges can vary widely. The "average" or mean is the midpoint between the top and bottom charges, explains Dill. You get it by adding up the values of all reported charges, then dividing that sum by the number of reports. Median refers to the number in the middle of the range. It's less sensitive to extremes, and is a better measure than the average, she adds.

Some variations may be due to lack of awareness of local competition or how many jobs are accepted by custom operators, she adds. Again, the greater the number of responses, the more reliable the data. Other factors include location, field size and topography; crop yields, soil conditions, weather conditions, work quality, equipment size and timeliness.
Notable trends
Most custom operations varied little from 2015 to 2017. But here are a few more notable averages that have steadily increased since 2011:
• Moldboard plowing averages have trended higher since 2011, rising 24% from 2015 to 2017.
• Corn planting — no-till and conventional — also has trended higher since 2011, rising 15% to 22% from 2015 to 2017.
• Soybean planting — no-till and conventional — also trended higher since 2011, rising 15% to 18% from 2015 to 2017.
• Combining corn, soybeans and small grains rose 9% to 10% from 2015 to 2017.
Maryland’s full 2017 report, including all rates having responses, minimum and maximum charges, plus comparative rates with previous surveys, can be found here.
For Pennsylvania’s 2016 Machinery Custom Rate report, click on this story "2016 Pennsylvania custom rate guide arrives". Or download it directly from here.
About the Author(s)
You May Also Like


