June 23, 2016
Corn and soybean prices have increased in the past several months (see farmdoc daily, June 13, 2016), leading to improved 2016 income prospects. Even given these price increases, working capital is still projected to be negative for rented farmland, leading to a continuing need to cut costs. When making these projections, yields are at their expected levels. Lower yields would result in higher working capital losses. More accurate income and working capital prospects will be known in August, once yield levels are more certain and attended price responses come into clearer focus.
Price Scenarios Examined
Working capital changes are estimated for three price scenarios. The first represents 2015 and uses estimated market year average prices of $3.83 per bushel for corn and $9.13 per bushel for soybeans (see Table 1). Based on these prices, the Agricultural Risk Coverage - county coverage (ARC-CO) payment for 2015 is estimated at $42 per acre (see Table 1). The 2015 ARC-CO payment represents an average over corn and soybean base acres, and will be made in the fall of 2016.
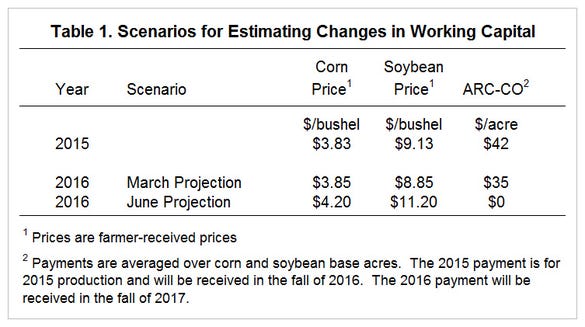
Working capital will be estimated for two 2016 scenarios. The first uses 2016 prices projections made during March 2016. These prices are $3.85 per bushel for corn and $8.85 per bushel for soybeans (see Table 1). ARC-CO payments are estimated at $35 per acre. The 2016 ARC-CO payment will be received in the fall of 2017.
Prices have risen since March. Currently, the market is offering $4.20 per bushel for corn delivered in the fall, $.35 per bushel higher than in March. Soybean fall delivery price is $11.20 per bushel, $2.35 per bushel above than in March. These June projections will increase crop revenue; however, ARC-CO payments would decline. ARC-CO is estimated not to pay at these higher prices (see Table 1).
The June projected prices of $4.20 for corn and $11.20 for soybeans are near what many believe the levels at which prices will average over the next several years. Irwin and Good suggest long-run "average" prices of $4.35 for corn and $10.44 for soybeans (farmdoc daily, April 22, 2016). The June projected corn prices is slightly below the long-run average: $4.20 June projection versus $4.35 long-run price. The soybean projected price is above the long-run price: $11.20 June projected price compared to $10.44 long-run price. If the June price projections hold and yields are near expected levels, 2016 should be viewed as a typical revenue year.
Situation for which working capital is projected
Working capital changes are estimated for central Illinois on low-productivity farmland. Key assumptions in projections are:
Expected yields of 185 bushels for corn and 53 bushels per acre for soybeans are used. At this point, it seems premature to change yields from expectations, but concerns exist that dry weather could result in lower yields. The next month will be crucial for corn yield determination and the next two months for soybeans.
Non-land costs come from Illinois Crop Budgets. Built into these budgets are decreases in non-land costs. Projected non-land costs for corn are $564 per acre in 2016, $37 per acre less than the 2015 cost of $601 per acre.
Cash rent in 2016 is $220 per acre, down by $10 per acre from the 2015 level of $230 per acre. These levels represent "averages". Much higher (and lower) cash rents are paid than these averages.
Working capital changes for 2015 were projected for this situation last year in a farmdoc daily article released on October 6, 2015.
Working capital changes are projected for owned, cash rent, and share rent farmland, with values stated on a per acre basis.
Projected working capital changes
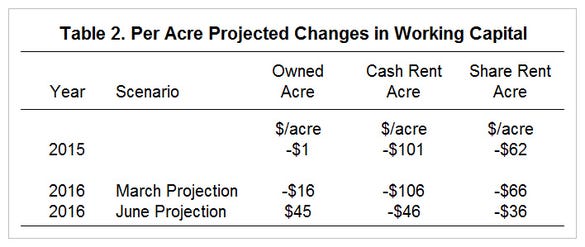
In 2015, working capital changes were -$1 per acre for owned farmland, -$101 per acre for cash rent farmland, and -$62 per acre for share rent farmland (see Table 2). These are large losses and led to significant deterioration of working capital. Those farms that had a higher percentage of the cash rent acres had larger losses than those with fewer cash rented acres (see farmdoc daily, June 17, 2016). Farms paying more in cash rents had larger losses than those paying less.
These working capital losses are in line with the experience of many farmers and lenders when reviewing end-of-year financial statements in 2015. Working capital was much lower on the end-of-year 2015 balance sheets as compared the beginning-of-the-year balance sheets. If 2016 losses are as large as 2015 losses, many farmers would see working capital levels back to 2000-05 levels, minimal levels of working capital. More vulnerable farmers would see operating credit severely limited such that 2017 production will not be possible without significant cuts in non-land costs and in cash rents.
The March projected prices result in working capital losses very similar to those experienced in 2015 (see Table 2). Working capital changes for 2016 using March prices are -$45 for owned land, -$46 for cash rent farmland, and -$36 for share rent farmland. This scenario suggests continuing large working capital losses.
June prices have much lower working capital losses than March prices. Owned land has a working capital change of $45 per acre under June prices, compared to a -$16 loss using March prices (see Table 2). Cash rent farmland has a -$46 per acre change under June prices, roughly half the loss of -$106 per acre under March price. Share rent has a -$36 per acre loss under June prices, compared to a -$66 per acre loss under March prices.
Ways to further reduce costs
Recent increases in prices result in lower projected working capital losses, which are very welcome and extremely helpful for stabilizing the financial position of farmers. However, working capital losses are still negative for rented farmland. Cost cuts likely will be needed to avoid working capital losses in 2017.
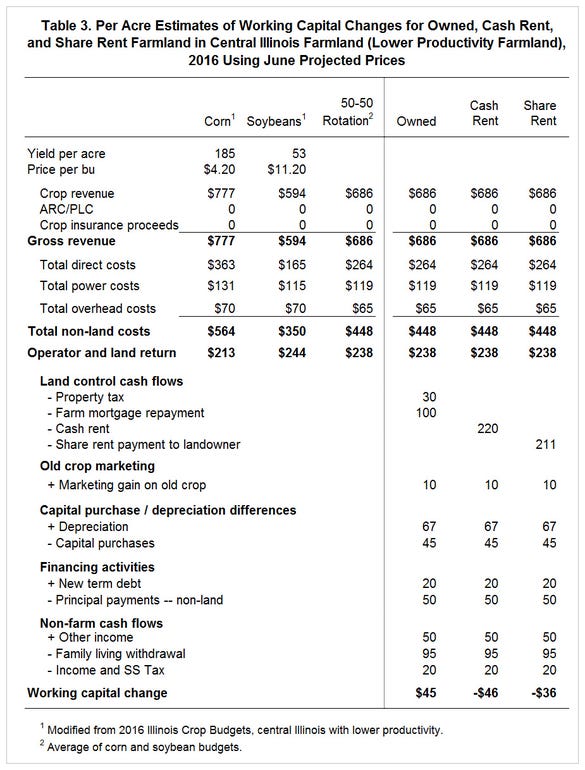
Projections use expected yield and prices near long-run averages, suggesting that revenue increases should not be expected to eliminate the $46 loss for cash rent farmland (see Table 3). Rather cost cuts must continue. Table 3 shows working capital calculations and is used to illustrate areas of potential cash flow cuts. Most likely areas for further reductions are:
Non-land costs. Non-land costs must continue to decrease. Built into the 2016 estimates are a significant reduction in costs mainly coming from fertilizer costs decreases. So far, seed costs have not decreased much. Seed costs increased considerably between 2006 and 2012 (farmdoc daily, September 16, 2014). Reductions in seed costs likely are necessary for further significant non-land cost cuts to continue.
Cash rent. Projections use a cash rent of $220 per acre (see Table 3), down from the high of $243 per acre in 2014. It is likely that continuing cash rent cuts are needed. For those cases where cash rents are significantly above average, farmers will have to decide whether to continue to farm land with high cash rents. Given that June prices result in a "typical" revenue year, continuing sustained losses for cash rent farms may not be prudent
Capital purchases. The scenario built in Table 3 has capital purchases of $45 per acre (see Table 3), below the current depreciation levels of $67 per acre, and near the average between 2000 and 2005. Some farmers may be able to lower capital purchases for several years, thereby reducing the drain on working capital.
Family living. Non-farm cash flows include a positive $50 per acre of other income, an outflow of $95 for family living, and an outflow of $20 per acre for taxes; yielding $65 per acre outflow for non-farm activities. Cutting family living levels may be prudent.
These 2016 working capital projections are based on expected yields. Current price levels may be built on market expectations of below average yields. Lowering yields would worsen working capital losses.
Information contained in USDA reports released at the end of June could change prices. Moreover, the current yield determination periods for corn and soybeans are near. In August, yield levels will be more certain, and associated price responses will be underway, leading to the ability more accurately project net income and working capital changes for 2016. However, it is unlikely that a price and yields scenario will arise that still does not result in the need to cut cash flows, particularly on rented farmland.
You May Also Like


