February 19, 2018

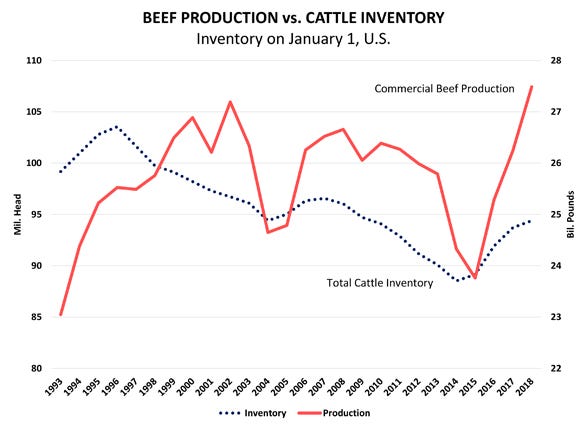
The numbers in USDA’s recently released annual Cattle Inventory Report confirm that beef herd expansion continued in 2017, albeit at a slower pace than in 2016.
Beef herd expansions often last for four to six years. The current expansion began in 2014 and could continue for another year or so. If it does, beef production in this cycle likely would not peak until early in the next decade.
Reported inventories are critical to understanding fundamental cattle market supply trends. Cattle counts also provide insight into demand for inputs such as feedstuffs. U.S. feed and residual corn use is projected to be 5.55 billion bushels, the largest since 2007-08. Not coincidentally, that was the last peak in the cattle inventory. Nationally, 2017-18 corn marketing year prices are projected to average $3.05 to $3.55 per bushel. Conventional wisdom suggests, all else equal, corn prices would be much lower without the strong feed demand.
As of Jan.1, the U.S. inventory of all cattle and calves was up 0.7% at 94.4 million head. The beef cow inventory was up 1.6% to 31.7 million head. Beef replacement heifers were down 3.7% to 6.1 million head. Dairy cows were up a slight 0.6% to 9.4 million head, and dairy replacement heifers were up 0.6% to 4.8 million head. The feedlot inventory for all feedlots was up 7.2% to 14 million head.

Improving herd productivity pushes beef production sharply higher during cattle cycle expansion phases. Fewer cows are needed to hit a given beef production target, as each cow results in an increasing amount of beef production.

The 2017 calf crop was up 2% to 35.8 million head. A bit surprisingly, USDA revised the 2017 calf crop downward by 491,800 head from July’s preliminary estimate. Nonetheless, 2017 saw the third consecutive larger calf crop. More calves boost pipeline supplies and eventually hike cattle slaughter.
Feeder cattle stampede into feedlots
A headline grabber in the report was an estimated year-over-year decline of 607,400 head of feeder cattle outside of feedlots. Using the inventory categories for steers and other heifers over 500 pounds plus calves under 500 pounds, and subtracting cattle already in feedlots, leaves a Jan. 1 estimated feeder supply of 26.1 million head, down 2.3% from Jan. 1, 2017.
Feeder supply can drop when cattle numbers are still rising. The total inventory of steers, other heifers, and calves was up 0.8%. But large feedlot placements in 2017 pulled the Jan. 1, 2018, feedlot inventory up 7.2% year over year, meaning that more 2017 crop calves are already in feedlots. Monthly cattle-on-feed data provide confirmation. Placements of cattle 600 to 699 pounds were up 11.9% year over year in 2017, and placements of cattle weighing less than 600 pounds were up 15.9%.
If realized, the smaller feeder supply could be a catalyst that could spur shorter-term advances in feeder prices, and help support deferred fed cattle prices on the presumption that feedlot placements in 2018 will be smaller than previously expected, leading to lower-than-expected fed beef production later in 2018. This would also well position the market to deal with the still rising cattle numbers.
Despite a 237,000 head drop in heifers held for beef cow replacements to 6.1 million head, cow-calf producers are still holding historically large numbers of replacement heifers. Except for the last two years, you must go back to 1996 to see this many heifers for beef cow replacement. Of the total beef replacement heifers, 3.8 million are expected to calve in 2018. This is the third-highest number since this data became available in 2001.
Replacements remain large in absolute number and as a percentage of the beef cow herd. Ample replacements and the larger Jan. 1 cow herd leave room for the 2018 calf crop to expand, suggesting further growth in total cattle inventory into 2019.
The question is whether producers are adjusting their intentions. Producers can easily divert open replacement heifers into feeder markets if their expectations change. Such a shift could easily boost feeder cattle supply and derail further expansion.
Regardless of how large feeder supplies end up being, aggressive feedlot placements and marketings were key factors to the strong 2017 market performance and will be again in 2018.
Eye-catching Iowa numbers
Iowa producers have expanded the beef cow herd to 970,000 head; that’s 5,000 cows more than a year ago and the largest state beef cow herd since 2007. Growth rate is well below the pace of the last two years. Plus, producers are holding fewer heifers as herd replacements. The 10.8% drop in Iowa replacements could suggest herd expansion is over. It may well be. But the absolute numbers suggest that a limited amount of additional beef herd expansion is possible in 2018.
The Jan. 1 replacement inventory was 17% of the beef cow herd. This is down from record levels the past three years, but it is still higher than the average level of 14.5% for the 25 years before the beginning of herd expansion in Iowa in 2015. Market conditions will determine how much, if any, expansion occurs in Iowa in 2018.
With three years of lower milk prices, few factors support growth in the dairy cow herd. In Iowa, however, dairy cow numbers were up 2.3%, but dairy heifers being held to enter the herd were flat with year-ago levels. Iowa’s 220,000 dairy cows are the most since 1999. Producers are likely hanging on to cows for cash flow and keeping barns full to spread debt loads and fixed costs across more cows and milk.
Demand for feeder cattle has supported higher prices for the latest calf crop marketing year. Relatively low feeding costs gave producers the opportunity to send more pounds to market by feeding calves after weaning. The Jan. 1 numbers confirm many Iowa producers were backgrounding in 2017. After adjusting feeder supplies to reflect only weaned animals outside of feedlots, the estimated Iowa backgrounding supply is up 1.1% year over year.
Help USDA provide the most accurate data
USDA’s annual Cattle Inventory Report issued at the end of January contains the most detailed and extensive numbers on cattle inventories for the year just completed.
To obtain the data, USDA’s National Ag Statistics Service surveyed a random sample of 36,300 U.S. operators. That’s the most of any USDA cattle survey. NASS asked producers to report inventories as of Jan. 1 by mail, telephone, internet and personal interviews. Response to the survey is voluntary.
The NASS cattle data series also includes the midyear Cattle report and monthly Cattle on Feed reports. Estimated inventories underlie analysis that can affect markets. Such market-impacting analysis may come directly from NASS reports, but often reaches users through news and information sources that depend on NASS estimates to form inferences.
Industry analysts combine survey data with statistical analysis to make production and marketing forecasts.
The quality of the NASS information and reliability of analyst’s forecasts depend heavily on a high level of producer participation in these surveys. The industry and analysts need consistency across data to make “apple-to-apple” comparisons. As the number of respondents falls, the statistical reliability of estimates and forecasts decline and the value of NASS estimates for many other purposes deteriorates as well.
Producers should watch for the NASS surveys that are mailed to them and respond. Your information matters!
Schulz is the Iowa State University Extension livestock economist.
About the Author(s)
You May Also Like


