January 9, 2020

The December USDA Hogs and Pigs report indicates producers continue expanding. The Dec. 1 hog breeding herd was 6.46 million head, 135,000 head or 2.1% higher than a year ago.
The expansion pace may be accelerating. Based on producer responses to surveys, USDA raised December 2019 through February 2020 U.S. farrowing intentions by 19,000 sows from the first estimate in September to the second in December.
Corn supplies are plentiful, and the futures board is offering producers the ability to lock in a robust margin. Disease pressures so far this winter have been minimal. Producers striving to minimize new disease introduction is likely why operations and inventory numbers have been rising in traditionally less pig dense states.
As producers continue to make both short- and long-term decisions in managing their operations and inventories, it’s important to recognize that economics are driving the expansion and that regional differences exist. The ability to have pigs located where grain basis is traditionally weak and grain farmers are eager to access manure as a fertilizer resource makes it tough for any other location in the world to compete for environmentally friendly and low-cost production.
Data provide evidence
With the largest uptick in the breeding herd from Dec. 1, 2018. to Dec. 1, 2019, states with their additional head include:
Illinois at 30,000
South Dakota at 25,000
Missouri at 20,000
Wisconsin at16,000
Kentucky at 13,000
Kansas, Ohio and Pennsylvania each at 10,000
These states have their largest breeding herds in one, two or even three decades in some cases. South Dakota’s breeding herd inventory of 280,000 head is the largest since 1964.
I suspect USDA’s surveys continue to pick up the expansion in sow inventory due to the construction of new sow units. According to the Census of Agriculture, these eight states netted an increase of 812 operations with breeding inventory (farrow to wean, farrow to feeder and farrow to finish) from 2012 to 2017. Quite possibly some of the recent surge in breeding inventory may be because some of the new units were first populated with females at the end of 2017 and are now getting to full inventory. Also sampling for previous quarterly reports may have missed some expansion that got captured for the December report, which uses a more detailed sampling technique.
The December Hogs and Pigs report includes all hogs and pigs, breeding and market inventory estimates for each of the 50 states. The quarterly reports in March, June and September include individual published state estimates for the 16 major hog-producing states, and aggregates the remaining 34 states to comprise the U.S. total. Because the source of expansion was both inside and outside the major hog-producing states, the granularity of the December report is important.
Iowa continues to have the largest breeding herd (including sows, gilts and boars). As of Dec. 1, Iowa accounted for 15.6% of the total U.S. breeding herd inventory. North Carolina (13.9%), Illinois (9.1%), Minnesota (8.8%), and Missouri (7.6%) round out the top five.
Farrowings could rise further
Sows farrowing over the next two quarters were estimated to be above a year earlier. Sow slaughter during September through November equaled about 24% of the sows farrowing during the quarter, a relatively modest turnover rate that is just under the previous five-year average.
Nationally, farrowing intentions for December 2019 through February 2020 look in line with the breeding herd. Intended sows farrowing are up 1% from a year earlier, while the breeding herd was up 2.1%. If realized, the ratio of sows farrowing to breeding herd would be 48.4%, which is in line with the last few quarters. But the farrowing ratio has been as high as 49% for the quarter. A possibility exists that farrowing numbers may end up being higher, especially with a larger breeding stock.
Where could December‐February sows farrowing be larger? In Illinois, intended sows farrowing were unchanged from a year earlier, while the breeding herd was up 5.4%. The ratio of sows farrowing in December‐February to the Dec. 1 breeding herd would drop to 45.8%, compared to a five-year average of 49% and 48.2% last year.
Similarly, the South Dakota farrowing-to-breeding herd ratio would be 48.2% for the coming quarter, which would be 1.5 percentage points above last year, but below the five-year average of 52.2%. The potential declines could be aberrations, or more sows could, in fact, be farrowed than previously estimated. Of course, this assumes no revisions to breeding herd estimates.
Wisconsin and Kentucky could also see larger farrowings because of the rise in breeding herd (sow) numbers. Collectively, this could boost the output potential of the U.S. hog industry.
Hog supply large and rising
Market hog inventories on Dec. 1 were 3.1% larger than a year earlier. Most of the rise was in the heavier weight groups, which will primarily affect first-quarter production. Iowa, Minnesota, North Carolina, Illinois, Indiana, Nebraska, Missouri, Ohio, Kansas, Oklahoma and South Dakota accounted for nearly 90% of the market hog inventory.
Iowa, which by far has the largest market hog inventory, saw a big change, increasing from 22.58 million head in December 2018 to 23.79 million head in 2019, a change of 1.21 million head. This was the largest year-over-year increase in Iowa since 2006 to 2007.
Utah, Ohio and South Dakota each increased over 200,000 head of market hogs compared to last December. Nebraska added 200,000, Kentucky added 137,000, and Minnesota added 100,000. Following the breeding hog additions, Wisconsin’s market hog inventory rose by 29,000 head.
Missouri saw the biggest drop year over year, decreasing its market inventory from 3.18 million to 2.76 million, or 420,000 head. Missouri’s market hog inventory of 3.18 million head in December 2018 was unusually high, the highest since December 1980. The 2.76 million head in December 2019 is similar to the 2015-17 average. Missouri’s 20,000-head increase in the breeding herd surely consisted of more gilts being held for breeding and contributed to the decrease in market supplies of slaughter hogs.
Rounding out the top 10 market hog inventory states, Kansas was up 80,000 head, Oklahoma up 65,000, Indiana up 60,000, and North Carolina was unchanged. Illinois decreased 80,000 head, which was more than likely related to an increase in gilt retention.
How and why costs vary
The recently updated estimates from USDA’s Economic Research Service of production costs and returns offer an opportunity to improve our understanding of regional variation in the U.S. hog production.
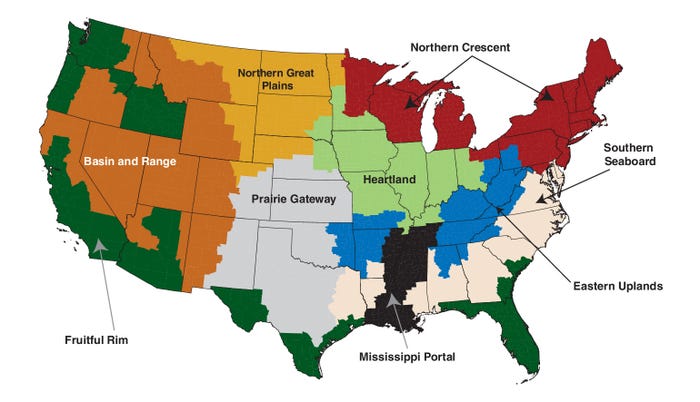
U.S. farm resource regions

Source: USDA’s Economic Research Service
ERS considers feeder-to-finish returns in three different regions, as well as the country as a whole (see map). These estimates, as well as documentation on how the estimates are derived, are USDA.
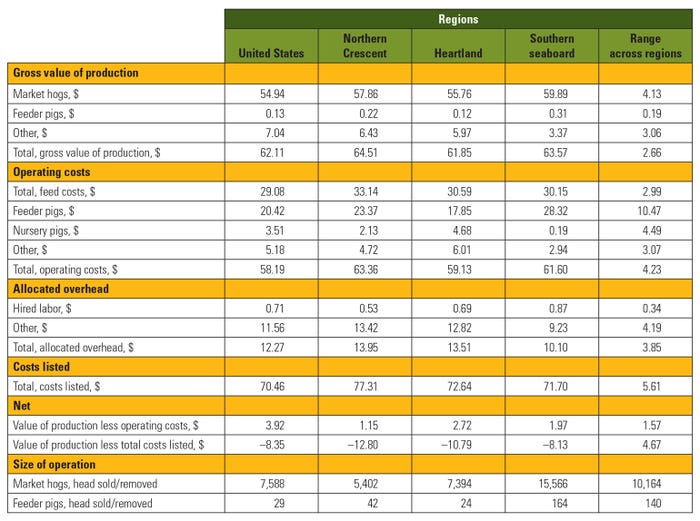
The table below provides a summary of how production costs and returns per hundredweight of gain varied regionally in 2018. Overall, the significant variation across regions reflects a host of factors. The table also highlights how Southern Seaboard production zones are characterized on average by larger operations than those in the Northern Crescent and Heartland. This gives them the ability to spread fixed costs such as labor, managerial ability and equipment over a larger volume of animals, reducing per-head expenses. This is referred to by economists as economies of scale.

Hog feeder to finish production costs and returns per cwt gain, 2018
Source: USDA’s Economic Research Service
Note the regional ranges for total cost are larger than for operating cost variations. Lower operating costs were the main reason why the return over operating cost was highest in the Heartland.
A much deeper and multiyear assessment is warranted, yet is beyond the scope of this article. However, all industry stakeholders should appreciate the key role of economies of scale.
At the aggregate level, this warrants consideration when assessing types of operations likely to grow during national herd expansion and persist during herd contraction. Such discussions are common today throughout the industry. How size of any given operation compares to others and the corresponding implications stemming from economies of scale in a commodity industry warrant similar recognition.
Schulz is the Iowa State University Extension livestock economist. Email [email protected].
About the Author(s)
You May Also Like


