Subscribe to receive top agriculture news
Be informed daily with these free e-newsletters

The UC IPM Weather Networks reports current hourly and daily data from weather stations throughout California, plus long-term data for climate stations. The information ranges from precipitation type/amount and wind speed/direction to relative humidity, solar radiation and evapotranspiration rates, depending on the individual reporting site.
If you’re looking for a nifty way to track all kinds of agricultural weather information from throughout California, check out the free weather data base on the University of California Integrated Pest Management website www.ipm.ucdavis.edu/WEATHER.
Whether it’s the 6 a.m. air temperature at Kelseyville in Lake County this past Monday or the minimum soil temperature yesterday at Lost Hills in Kern County, you can find it there.
The UC IPM Weather Networks reports current hourly and daily data from weather stations throughout California, plus long-term data for climate stations. The information ranges from precipitation type/amount and wind speed/direction to relative humidity, solar radiation and evapotranspiration rates, depending on the individual reporting site. You can also get detailed information about the location and characteristics of the weather station site, even including the location of various temperature, humidity and other sensors.
The information is provided by UC Cooperative Extension cooperators, about 100 California Irrigation Management Information System (CIMIS) stations, about 135 National Oceanic and Atmospheric Administration (NOAA) sites and some 40 volunteers. If that doesn’t exactly fit your needs, you can even link directly to the Western Regional Climate Center.
What’s more, the UC IPM site provides interactive tools and models that can help you make pest management decisions based on the weather conditions at a nearby weather station or a station you’ve set up in your vineyard. Here’s an example:
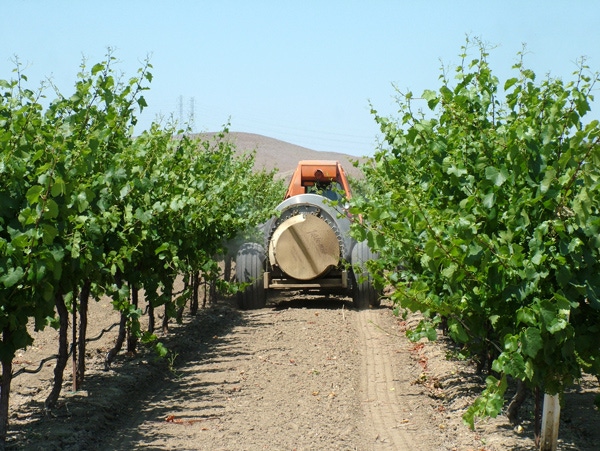
Some growers apply their pesticides, fungicides or other disease-protecting materials based on a given calendar date or stage of crop growth, such as at budbreak or bloom. “That’s when I sprayed last year, and I controlled the threat,” they reason.
That approach might work, if weather, field and crop conditions were the same every year. However, as Lindsay Jordan, UCCE viticulture farm advisor for Madera, Mariposa and Merced Counties, points out, no two seasons are identical.
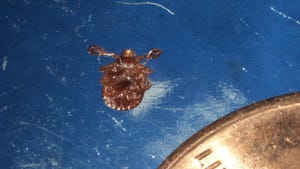
“For example, a warm spring will cause rapid and early development of the omnivorous leafroller,” she says. “If you wait to spray until the time you have previously seen OLR develop in your vineyard, you may be too late and risk potentially heavy infestation. That’s why it’s so important to know when to monitor your vineyard according to the growth of the insect, so you can spot any larvae in clusters or surrounding vegetation and determine the most effective time to treat for the pest.”
That’s where the UC IPM weather network can pay off. It provides links to information or models for using the weather data to manage a wide range of crop pests and diseases. This can help you determine the current stage of development of the various disease and pest threats and when it makes economic sense to treat for them.
Weather information related specifically to grapes, including some readings taken within the grape canopy, is available from the nine weather stations in the Fresno-Madera Grape Network, five in San Joaquin County and a total of five within El Dorado, Calaveras, and Amador counties
For grapes, that includes powdery mildew, the omnivorous leafroller and the orange tortrix (a grape pest in the coastal areas and valleys where there is a marine influence for part of the day) which causes the same kind of damage as the omnivorous leafoller in inland areas).
In the case of powdery mildew, for example, the UC IPM Weather Network site provides a link to the UC IPM Pest Management Guidelines for this disease, including recommendations for monitoring and controlling it using information from a nearby weather station in the network or your own weather station to calculate the Risk Assessment Index. This index is useful for determining disease pressure and how often you need to spray to protect the vines.
“The powdery mildew risk assessment index isn’t a silver bullet that will eliminate problems with the disease,” Jordan says. “Its value is in helping you spend your pest control dollars wisely. For example, if the index shows a low risk of powdery mildew pressure, you may be able to reduce your number of sprays during the season and save some money. On the other hand, in a year like this one, when the index showed an extremely high risk of the disease for three straight months in some areas of the San Joaquin Valley, growers who timed their sprays accordingly can confirm they made a good investment in powdery mildew control.”
Jordan encourages growers to explore the UC IPM Weather network to learn more about the wealth of useful information it provides. “It offers a number of features you may not be aware of,” she says. “Once you become familiar with it, it’s a really cool tool.”
You May Also Like
Enter a zip code to see the weather conditions for a different location.