Subscribe to receive top agriculture news
Be informed daily with these free e-newsletters

EEFlux applies METRIC onto the Google Earth Engine system; program will allow irrigators to measure water use across their field.
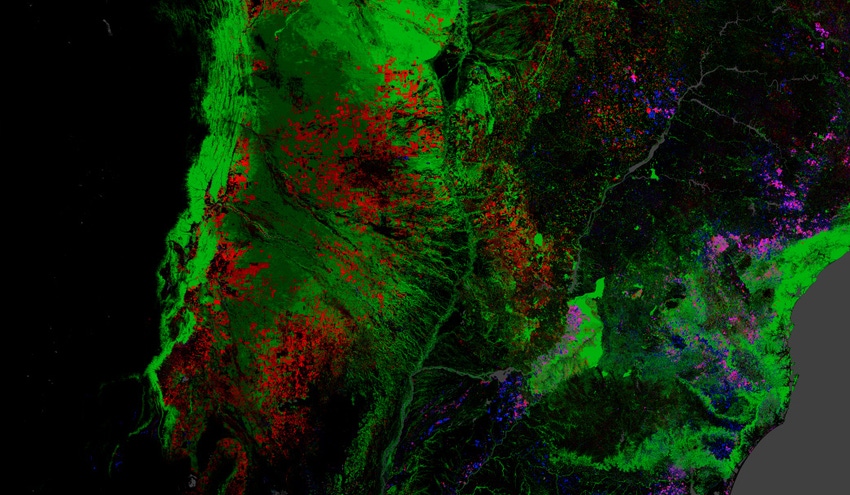
Imagine using Google Earth to zoom in to a field on your farm and see different images and indexes like vegetation, surface temperature, normalized difference vegetation index (NDVI), and evapotranspiration (ET). It might sound like something used by NASA, but a new tool, called EEFlux, provides a way for farmers to measure crop water use with Google Earth Engine.
EEFlux was developed over the last three years in a joint effort by University of Nebraska-Lincoln, the Desert Research Institute in Nevada, the University of Idaho, and Google.
EEFlux applies Mapping Evapotranspiration at high Resolution with Internalized Calibration (METRIC) onto the Google Earth Engine system. The tool uses Landsat thermal imagery, collected every 16 days back to 1984, to create maps from different bands and indexes at a pixel resolution of 30 meters. Each band of Landsat is like one color of the rainbow. When bands are combined, different characteristics of Earth's surface can be viewed – like vegetation, for example.
Ayse Kilic, associate professor with UNL's Department of Civil Engineering and the School of Natural Resources, and project lead, says the Google Earth Engine is the ideal platform for this program. "The Earth Engine has enormous computing and storage power," says Kilic. "Earth Engine provides access to everyone, and the ET information from Landsat covers the global spectrum."
EEFlux does this using a surface energy balance. This process involves using thermal and visible imagery from Landsat to collect three measurements: the sun's energy that goes toward heating the ground (ground heat flux), heating the air (net heat flux), and to evaporate water (ET). Because satellites can't see water vapor, researchers use the energy balance model – using net radiation (Rn) from the sun and sky, ground heat flux, and net heat flux to solve for ET. Based on thermal and reflectance data, users have access to vegetation indices such as the normalized difference vegetation index (NDVI) and to Albedo (total reflected sunlight) imagery, and based on the surface energy balance, access to ET maps.
The Level 1 version of EEFlux is currently available, and Level 2 and Level 3 are in the works. Level 1 is free and calibrates data automatically, while users can subscribe to Level 2 and 3 to calibrate on their own using additional insight.
However, Kilic, as well as Doruk Ozturk and Ian Ratcliffe, remote sensing specialists at UNL's Center for Advanced Land Management Information Technologies (CALMIT), who are a part of Kilic's team, say there's still a lot of coding to be done.
This includes working with different programming languages, including Javascript, the programming language used as the Google Earth Engine playground, and Python, the programming language used for the website and dashboard that allows users to select different bands, like NDVI, Albedo, False Color, Reference ET, and Actual ET.
It also includes testing each component of EEFlux to help the Google team create application programming interfaces (API's), or protocols to help simplify the calling routine of the EEFlux code and incorporate any of Google's updates or enhancements. In short, this will help EEFlux run faster and more smoothly.
"The testing that we are currently doing will insure that EEFlux provides the correct estimates of water consumption. We know that accuracy in water is important," adds Ratcliffe.
Kilic notes while there is currently just one Landsat producing complete imagery for the globe, ideally, there should be as many as four or even eight. This way, it's easier to get more cloud-free images throughout the month. With one satellite and about two images per month, only a few images collected throughout the year have 0% cloud cover in cloudy regions like Nebraska. The greater the cloud cover, the more potential to throw off ET calibration on the ground surface. Meanwhile, the team is working with Google's cloud masking tool to identify areas of cloud cover and remove them from the map to improve the accuracy of the imagery.
Once all the bugs are worked out, the program will provide ag irrigators a means of measuring water use spatially across their field. "Growers can look at ET to see variability in their field," Kilic adds. "ET shows how much the plant consumes. It shows water consumption. The healthier the plant is, the more water consumption you can expect – just like humans. It's showing how much activity they're involved in in their metabolism. It's also showing the yield potential, because the more active the plant is in taking up water, the less "stress" it is subjected to, and the more yield potential there is."
And Ozturk says it could even be used to schedule irrigation. "In the long run, if you know how much water your farm is consuming pixel by pixel, and if you can get a forecast for how much precipitation will come for the next seven days, you can predict how much water your field will use based on weather patterns," he says. "You can schedule irrigation based on that information."
You May Also Like
Enter a zip code to see the weather conditions for a different location.