December 6, 2018

By Jessica Merzdorf
Temperature and precipitation changes and extreme weather are becoming more common in Indiana. Meanwhile, farmers can take advantage of satellite-based data tools to help track effects on their farms. Here are some online resources and apps powered by NASA data.
These tools are from USDA’s National Agricultural Statistics Service:
• Crop Explorer. This user-friendly tool displays maps of data on weather, soil moisture, drought and crop health, along with data tables on commodity and yield reports.
• CropScape — Cropland Data Layer. CropScape combines NASA satellite data and farmer-reported data on crop cover to generate an annual map showing where each crop is planted. The data has a resolution of 30 meters, meaning that each pixel on the image represents 30 square meters of ground. This makes it useful for viewing individual fields and farms. Each growing season’s data is released in January of the following year. So, 2018 data will be released in January 2019.
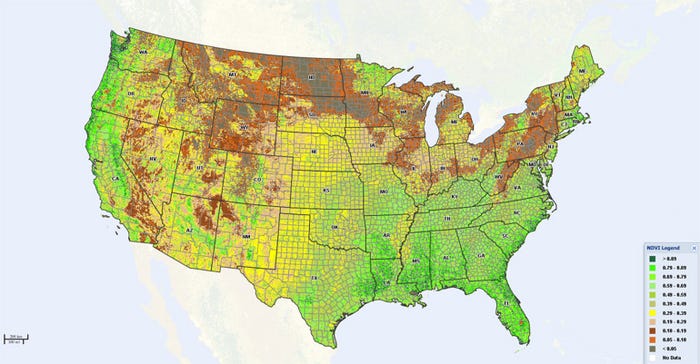
• VegScape — Vegetation Condition Explore. VegScape contains information on crop health and condition like Crop Explorer on a map like CropScape. The map is updated daily. Users can view the index for a day, a week or a two-week time frame. VegScape has a 250-meter resolution, somewhat lower than CropScape and likely too low to be useful for individual fields, but suitable for county-level conditions.

U.S. VEGETATION FROM THE AIR: This example of the VegScape tool from USDA-NASS shows data from the Normalized Difference Vegetation Index, or NDVI. This index measures how much visible and invisible light reflects from Earth’s surface and generates an index of how healthy crops are.

Here are other tools and apps:
• Earth System Data Explorer. This tool from NASA provides access to a variety of historical data sets about the earth’s biosphere or plants, ocean, atmosphere and hydrosphere or water systems. With helpful tutorials to guide usage, this tool allows users to see visualizations of long-term trends in precipitation, plant health and other metrics. This is not a fine-grained tool that can provide reports for individual fields or counties, but rather over large areas. Data can be exported to Google Earth or other software for further analysis.
• SSEC-RealEarth. This app from the University of Wisconsin allows users to access map overlays from a variety of NASA and non-NASA satellites, showing cloud cover, fires, weather forecasts, land cover, precipitation and other information. Some data is more or less up-to-date depending on the satellite’s orbit timing, and users may have to do a bit of external research to understand how to use each data set. Users can display multiple overlays at the same time and save their favorite tools and visualizations.
• SSEC-GOES. This app uses data from NASA-NOAA Geostationary Operational Environmental Satellite Program satellites, which measure visible and infrared lightwaves to predict weather phenomena, map lightning, and monitor space and solar weather or particles from space and the sun that affect our atmosphere. The SSEC-GOES app allows users to view a variety of map overlays regarding weather conditions and to toggle back and forth between visible and infrared displays. Like the RealEarth app, users may need to do some extra research to understand what each data set means; the app is highly customizable.
Read more about user-friendly NASA data tools at nasawavelength.org/data-and-images.
Merzdorf is a graduate student in ag sciences education at Purdue University and is participating in the Purdue ag communication Capstone experience.
You May Also Like


