September 6, 2023
by Catherine DeLong
The Iowa Nutrient Reduction Strategy (INRS) was established in 2013 to set and track goals for reducing nitrogen and phosphorus in the state’s water by 45%. Although there is a general understanding among stakeholders of the INRS and its goals, many people do not know what progress has been made, and how far there is to go.
For many Iowans, learning about progress toward these goals has been through a variety of media reports; for those who are ready and able to actively dig for details, there are published reports and learning sessions provided by professionals at conferences, field days and through online channels — until now!
The latest version of the INRS Interactive Data Dashboard is open for access by anyone. The dashboard is designed to present data collected and reported by numerous organizations in an easy-to-use visual format. Iowa State University Extension and Outreach invites everyone to visit the dashboard and spend a few minutes exploring.
Each section of the dashboard introduces what is being reported and why, followed by data in easily digested bites. When more information is needed or deeper research makes sense, the reports and source data are hyperlinked within the dashboard sections. This allows a user to delve into the details that they find interesting, such as real-time water quality monitoring that can be accessed through resources like the U.S. Geological Survey National Water Dashboard and the Iowa Water Quality Information System.
Tracking
The dashboard follows the six tracking dimensions defined in the INRS. Each section offers users the ability to explore the most current information and select data of interest. This timely, flexible access is designed to serve the needs of landowners, agricultural professionals, retailers and service providers, urban and rural residents, community groups, reporters and researchers looking to learn more about progress at different scales including watershed, county or statewide perspectives.
The core indicators and related tracking dimensions available in the dashboard are:
Tracking funding and resources
Tracking the human dimension
Tracking permits to wastewater and industrial facilities
Tracking land use and in-field practices
Tracking edge of field and erosion control practices
Tracking water quality and nutrient export
Within each dashboard topic area, users can access data and drill down to their personal areas of interest or inquiry. Each interactive dashboard section can easily be expanded to full screen, and the user may explore the subset data displayed using on-screen controls, sliders or by selecting items in the legend. Manipulating the displayed information can facilitate the utility of the data to help answer the specific question of a dashboard user.
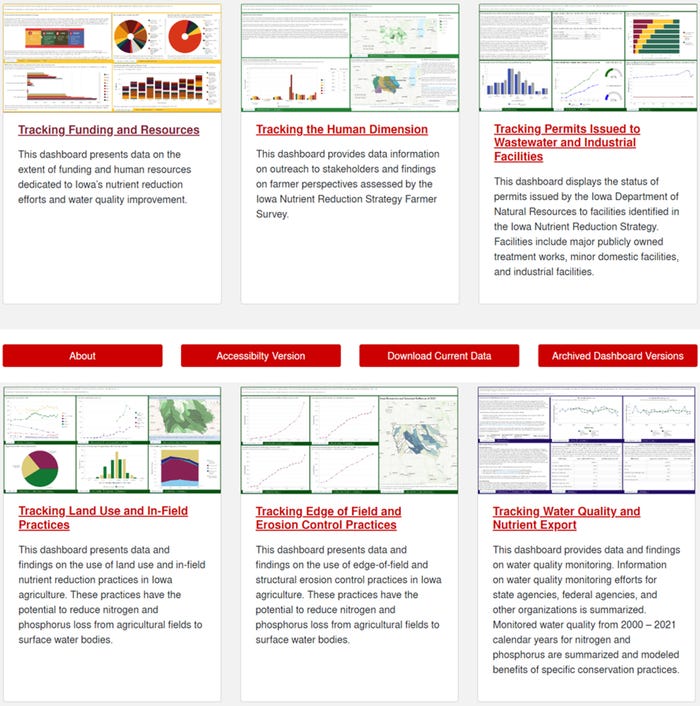
DASHBOARD DISPLAY: The data dashboard shows important information needed in nutrient reduction.
For example, a drainage contractor seeking new project opportunities may want to see the number of bioreactors and saturated buffers deployed in their area. With a few clicks, they can see that the Upper Cedar Watershed has 12, but when reviewing the entire state, they can take note that there are many watersheds with none of these practices, and some in adjacent watersheds with just a few — revealing potential opportunities for new work.
Learning
Whether for planning, outreach or business development, these available data can point the way to learning more about available funding, human perspectives on different practices, how farmers and landowners in the focus area get their news and information about conservation practices, and the impacts these practices are reported to have on N and P reductions.
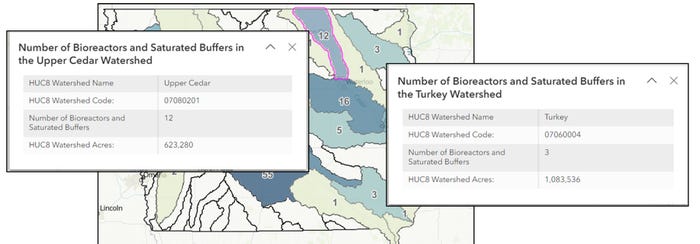
BUSINESS OPTIONS IN WATERSHEDS: This display identifies commercial opportunities in watershed areas.
Different users are anticipated to approach the dashboards from differing perspectives. Landowners and farmers may be more interested in learning what is happening on the ground near them than in statewide metrics. The dashboard empowers this use model by easily displaying locally relevant information such as the number of outreach events by county or conservation practice adoption at the watershed scale. Or they can see what funding may be available or has been tapped for nearby projects.
Other features of the dashboard that facilitate use and utility include data downloads and an accessibility version, which displays information in a tabular format that is compatible with screen readers.
We invite you to see what you might find useful and learn more about water quality efforts in Iowa by visiting the INRS Interactive Data Dashboard.
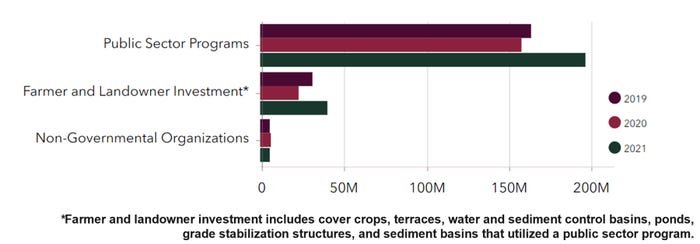
WHERE FUNDS COME FROM: Non-Conservation Reserve Program funding for NRCS in dollars by partner organizations 2019-21 reporting period.
Feedback and suggestions on how the dashboard could be improved to deliver the most beneficial data and experience are always welcome through the INRS comments page or by email to the dashboard coordinator.
Resource links:
In the next article, we will discuss the use and benefits of the “batch and build” approach to conservation practices and water quality improvements that are helping to drive progress and momentum toward meeting INRS goals.
The Iowa Nutrient Reduction Strategy
The Iowa Nutrient Reduction Strategy (INRS) was developed by the Iowa Department of Agriculture and Land Stewardship, Iowa Department of Natural Resources and the Iowa State University, College of Agriculture and Life Sciences in 2013. Iowa was an early adopter with the development of the INRS to support the Environmental Protection Agency goals for the Gulf of Mexico to reduce the size of the annual hypoxic zone to less than 5,000 square kilometers on a five-year moving average by 2035. The strategy outlines opportunities for reducing nutrients in surface water from both point sources, such as municipal wastewater treatment plants and industrial facilities; and nonpoint sources, including agricultural operations and urban areas, in a scientific, reasonable and cost-effective manner.
DeLong is the water quality program manager with Iowa State University Extension and Outreach.
You May Also Like

