
Subscribe to receive top agriculture news
Be informed daily with these free e-newsletters
The January USDA report is always one of the most anticipated reports that USDA releases during the year. In the report, USDA updates the U.S. and World supply and demand tables, final yield and production numbers for 2016, quarterly stocks on December 1, and winter wheat plantings. (See USDA Reports and Supply & Demand Tables)
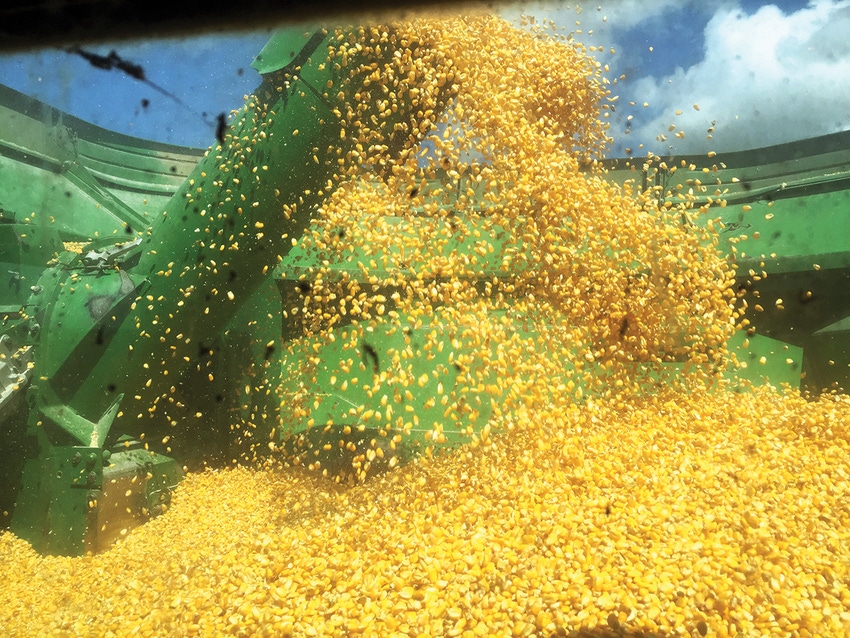
In the January 12 USDA report for corn, there were no major surprises. The yield, production, harvested acres, and ending stocks came in slightly smaller than the trade estimate and the December report. You can find all the details at at USDA Reports and Supply & Demand Tables.
The yield was trimmed 0.7 bushel to 174.6 bushels/acre and harvested acres were cut 100,000 acres. Feed use was cut 50 million bushels, but ethanol was increased 25 million.
The final result was ending stocks were cut 48 million bushels to 2.354 billion bushels, an ample supply of corn. The quarterly stocks came in 60 million bushels greater than the average trade guess but within the range of estimates. Overall a neutral report.
Going forward I will keep watching exports, South America weather and growing conditions, and U.S. weather and planted acres for 2017.
Exports have been strong but have slowed the past few weeks. Corn for ethanol continues to be positive with exports to China, Canada, and Brazil.
The South America weather is a mixed bag so far this year. Excessive rainfall and flooding in Argentina will result in fewer corn acres, which should result in a drop in production, but still a big crop. Brazil on the other hand is a little on the dry side in some of their major growing areas. However, two-thirds of their corn production comes from second crop corn.
Looking ahead to 2017 plantings, many are expecting acres to be down 2 million to 4 million. If acres are down 2 million with steady demand and a trend line yield at 169, ending stocks would fall to 2.3 billion bushels. That projects to a season average price in the $3.49 to $4.03 range.
A 4 million drop in acres with trend line yields and steady demand drops ending stocks to 2 billion bushels and a season average price in the $3.57 to $4.10 range. This gives a little bit of optimism if yields come back closer to trend line and the opportunity to forward price new crop corn over $4.
Technically, March futures are in a trading range between $3.45 and $3.65. If you need to make old crop sales, I would start scaling in some sales now and especially if prices rally back to $3.65. The 200-day simple moving average is at $3.70 and will be strong resistance on rallies and a break above this moving average would signal a change in the supply and demand.
December futures are in a trading range between $3.75 and $3.95. A strong close above $3.95 would open the door to $4.10 to $4.20. Until there a major problem with South American corn crop, I think we are range-bound going into the spring. With futures prices close to the top of the range, getting a few bushels sold on the futures may not be a bad idea.
However, I would use weather rallies — especially into the summer — to make the bulk of the new crop corn sales.
Soybeans had the most bullish report. The yield was cut 0.4 bushel to 52.1 bushels/acre, and the ending stocks were lowered 60 million to 420 million bushels. The harvest acres were reduced 300,000.
The quarterly stocks were projected at 2.9 billion bushels, 60 million less than the average trade estimate. While it was good to see less soybean stocks in this report, the total soybean stocks are adequate, and depending upon the acres planted this spring, we could see a big jump ending stocks for next year.
For the 2017 crop, acres are projected to increase 2 million to 4 million acres.
A 2 million-acre increase to 85.7 million with a trend line yield of 48 bushels per acre and steady demand will keep ending stocks around 460 million bushels. This projects to a season average price range of $9 to $11 per bushel.
If acres are increased 4 million to 87.7 million, ending stocks will jump to 550 million with a season price range of $8.80 to $10.84.
To get ending stocks below 300 million bushels, the average yield will need to drop 5 percent to 44 bushels/acre.
Unless we have production problems in South America, it is going to be difficult to sustain any significant price rallies. A farmer needs to be aggressive in selling both old crop and new crop soybeans. The ending stocks for the 2016 crop may get trimmed some more depending upon exports, but still will be large.
Technically, March futures has found some good support $9.90 and resistance at $10.70. For November futures, support is at $9.80 and resistance at $10.40.
Unless we have production problems in the South America and with the outlook of 4 million or more soybean acres in 2017, sustained rallies will be difficult, and a farmer needs to be aggressive in making some sales.
There were no major changes or surprises in the USDA January report except for winter wheat acres. Winter wheat acres are projected at 32.3 million, 2 million less than the pre-report guess and 3.7 million acres less than last year. This is the smallest winter wheat acres in 100 years.
While this will give some support to wheat prices, production and ending stocks in the United States and world remain large.
Technically, July 2017 futures has support at $4.20 and resistance at $4.70. The next major resistance is in the $4.80 to $4.90 range. At this time, I do not expect any major rally unless there are production problems somewhere in the world.
USDA made small changes in the U.S. cotton balance sheet with ending stocks increased slightly from 4.8 million to 5 million bales. World ending stocks were increased 1.5 million.
It is important for a cotton producer to remain in close contact with his cotton buyer to get the most current price quotes.
Technically, March 2017 cotton futures broke above the top of the trading range at 73 cents with a run up to 75 cents before pulling back to 72 cents. Support is at the 69-cent level.
December futures ran back up to the early fall high of 72 cents before pulling back to 70.5 cents. Support is at 68.5 cents.
USDA cut rice production by 10.7 million cwt and the ending stocks were adjusted downward from 59.7 to 50 million cwt.
For cash rice quotes, contact your rice buyer to get the most current price quotes and cash price outlook.
Technically, March rice futures has support at $9.40 and resistance at $10.20.
You May Also Like
Enter a zip code to see the weather conditions for a different location.


