How can you achieve higher yields? Bob Nielsen says it’s not as complicated as you might imagine.
“The secret to achieving higher yields in the future is to figure out why you’re not achieving higher yields today,” says Nielsen, the Purdue University Extension corn specialist. That means determining the primary factors limiting yield year in and year out on your farm, he says.
“There is no silver bullet to higher yields,” he continues. “You can make progress by taking a hard look at what’s holding back yields on your farm.”
To begin that process, Nielsen suggests taking advantage of tools available today that can help you zero in on limiting factors. Here is a closer look at a few that belong in your toolbox.
Useful diagnostic tools
Theses diagnostic tools can help:
Yield maps. “Use yield maps as a roadmap to identify problem areas in a field,” Nielsen suggests. Often, people use yield maps to identify management zones and focus on higher-yielding areas. In this instance, he suggests focusing on the low-yielding areas on your maps.
“The areas where the map shows 250 bushels per acre are impressive, but what is wrong in the red areas where you’re at 150 to 180 bushels per acre?” he asks. “It’s even more meaningful if you have data from multiple years and the same areas are consistently lower yielding. Start your search for more yield there.”
Aerial images. If you are licensed to fly a drone or your consultant offers the service, consider taking advantage of aerial imagery and mapping during the growing season. “You may be able to pick up problem areas earlier through aerial images than waiting to see a yield map,” Nielsen says. “If you can spot it earlier and do the diagnostic work to identify the problem, you may be able to take corrective action the same season or at least identify the true cause. It can be a more efficient process.”
He points to a late-August example from 2020. A drone flight over a corn field indicated that areas of a field were dying because of severe drought stress. If that’s all you knew, you would write it off to a bad break with the weather on drought-prone soils. “In this case, there were UAV flights of the same field from earlier in the season,” Nielsen says. “Symptoms were starting to show up before drought stress set in. It turned out that the real cause was root damage caused by soil compaction, not simply stress due to drought.”
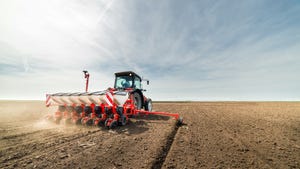
As-applied maps. Most equipment that applies inputs today, such as nitrogen, has the capability to produce as-applied maps. “These can be helpful in identifying problems that relate back to equipment issues,” Nielsen says.
For example, suppose an applicator nozzle plugged. The as-applied map should indicate a different nitrogen applications rate. “These problems can be hard to pick up on a yield map where several rows go through the machine at once,” he says.
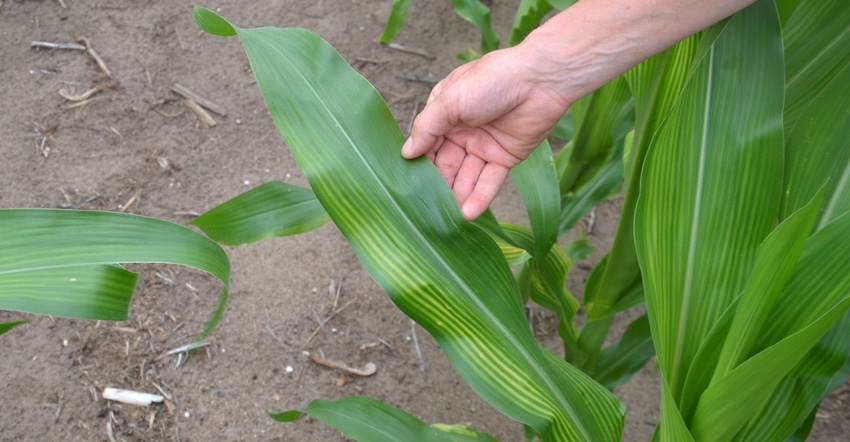
Tissue tests and soil samples. Pulling soil samples from good and poor performing areas can help determine if a nutrient deficiency is the cause, Nilsen says. Tissue testing during the season can also help identify yield-limiting deficiencies, especially if sulfur or a micronutrient is involved.
About the Author(s)
You May Also Like


