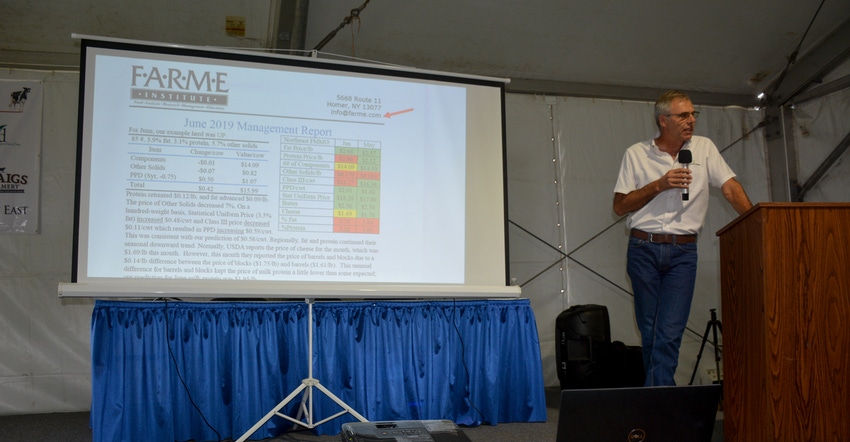
Looking for opportunities to improve your milk check? Look at your components and protect them.
Larry Jones, vice president of FARME Institute in Homer, N.Y., said reading the milk check will reveal a lot about what farmers can do to get a competitive advantage in price.
“This is all designed to look at your milk check,” said Jones, a dairy nutritionist and consultant who recently spoke at Empire Farm Days in Seneca Falls.
All about components
In the Northeast and for farmers who are in the Federal Milk Marketing Order, the Boston order, milk prices are driven by components — butterfat, protein, others — and the price for each component is the same no matter the farm. The only difference is how much a farm produces of each component, which affects the overall component price.
The next thing to consider is Producer Price Differential.
For instance, in federal order 1, the PPD is set in relation to Boston — the closer to Boston, the higher the PPD.
Other things can differ from farm to farm, including quality and volume bonuses, various market adjustments, and transportation costs.
Class I ‘myth busting’
Part of what Jones does is a little “myth busting,” especially in relation to Class I pricing and its effects on the milk check.
Most dairy farmers know that the price they receive in the mailbox is the result of a process that spans multiple months. For instance, July milk checks were influenced by Class I prices that were set in late May, when USDA published its Class I prices.
Component prices were set on July 3, and checks went out in mid-July.
A government bulletin released in June stated that Class I utilization was at its lowest point ever, under 30%.
“As a co-op, I’m scared to death. As a producer, I don’t freaking care,” Jones said.
Reason being? According to data he’s accumulated, lower Class I utilization doesn’t necessarily mean lower prices. June checks were the highest in a few years. At the same time, Class I utilization continues to tumble. It’s not that Class I isn’t important. Using a chart where Jones calculated uniform price vs. Class I price, for every point of Class I utilization lost, it results in, on average, 6 cents per cwt lost on price.
“But for determining standard uniform price, it’s not important. You’ve been fed this myth that we have to continue to drive Class I utilization,” he said.
Projecting prices
One project Jones is working on is helping farmers predict their pricing a month ahead of time. The goal is to find places where farmers can protect their prices.
On one farm he’s working with, Jones predicted a net mailbox price of $17.78 per cwt in June and $17.80 for July. That’s based on component prices and how much of a change there will be in the producer price differential.
So, how did Jones do? Well, turns out that his June price was off by 19 cents and his July price was off by 21 cents. Digging in, Jones said the price was off by 12 cents due to changes in the co-op premium and market adjustment deductions that he claims he had no way of knowing. The farm also produced slightly less in protein — he calculated 3.2 pounds, the farm produced 3.12 pounds.
On actual milk price, though, he calculates he was off by 3 and 4 cents.
Protecting profits
Jones has calculated the contribution of individual products to July’s standard uniform price. Overall, the value of butter to the standard uniform price was 34%; cheese, 38%; nonfat dry milk, 28%; and whey, 5%. Jones said he does this by setting values of each to zero and seeing what happens to the price of each.
This shows Jones which products might be more important to protect.
“If I’m going to protect butter and cheese, and if I forget about nonfat dry milk, I’m going to get burned,” he said. “I’ve got to protect all three of these if I’m going to protect milk price.”
Another graph he generates averages out three years of butter, cheese, nonfat dry milk and whey prices; adding in 12 months of futures prices; and setting the 90% average price. For butter, Jones said we’re at the highest average price with futures prices likely declining. Cheese and nonfat dry milk, though, are good bets.
“If I was going to take a position on cheese right now, I’d take a serious look at that,” he said. “We’re up at a level we haven’t been at the last three years.”
Nonfat dry milk is even better, he said, and it’s the best indicator of exports. Futures contracts are trading up to $1.20 a pound through 2021.
“Nonfat dry milk is trading much higher than it has ever traded the past three years,” he said. “When I’m seeing these nonfat dry milk futures, I may want to take a position on that. That’s a pretty unusual price.
“What happens in milk prices is an international market.”
About the Author(s)
You May Also Like


