Maybe you have never pulled a tissue sample in soybeans. If you’re ready to push toward higher yields, it might be worth considering.
“We can’t guarantee that it will allow you to make adjustments that will bump yields,” Betsy Bower says. “Sometimes it might even be difficult to explain what we learn. But there are times when you can pick up on trends that might not be obvious otherwise. It’s just another tool to add to your knowledge base for more-informed decisions.”
Related: Watch for early season issues in fields
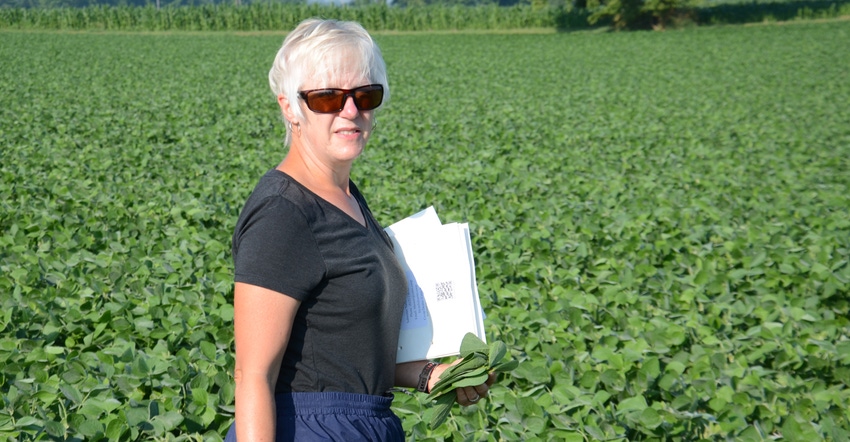
Bower is an agronomist with Ceres Solutions, based in west-central Indiana. Each year, she works with several customers who want to know what’s happening inside their soybean plants. Sometimes they can do something based on nutrient status that can add bushels the same season. Sometimes it points out trends to watch for down the road. And sometimes it leaves you scratching your head, looking for more pieces to help put the puzzle together, she says.
Beck’s sponsors Soybean Watch each year. Steve Gauck, a Beck’s regional agronomy manager, makes observations on a field centrally located in the Eastern Corn Belt. Organizers decided to add tissue testing in 2020 so growers could learn more about the practice. Bower trained the grower and others how to take samples. Ceres Solutions also covered costs for analysis at Sure-Tech Labs.
Try tissue testing
Bower demonstrated the technique on a field that wasn’t part of Soybean Watch. No-tilled into corn stalks in mid-April, by mid-July it appeared to have 80-bushel-per-acre potential. Soybeans were at the R2 reproductive stage. There was an open flower at one of the two uppermost nodes on the main stem, with a completely unrolled leaf.
“We target R1/+R2 to take the first leaf sample in soybeans,” she explained. “We may find something we can still address but it’s also a glimpse of what plants are taking up as they move into the critical reproductive stage.”
Bower pulled 25 trifoliate leaves from the northwest portion of the field, about 10 acres, placed them in a sampling bag and shipped it. Within a couple of days, she had results.
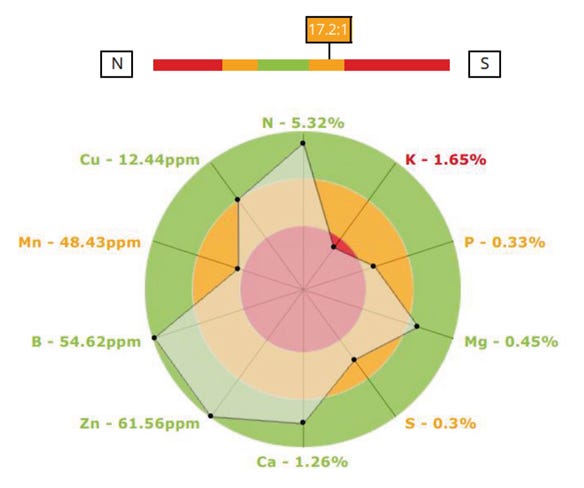
The lab reports actual numbers, plus displays them as a pie chart. Nitrogen, phosphorus, potassium, sulfur, calcium and magnesium percentages were 5.32, 0.33, 1.65, 0.3, 0.45 and 1.46, respectively. The lab classified these nutrients as adequate, responsive, deficient, responsive, adequate and adequate, respectively. Boron, zinc, manganese and copper were reported in parts per million: 54.62, adequate; 61.56, excessive; 48.43, responsive, and 12.42, adequate, respectively.
 EXAMINE RESULTS: The lab report includes data, plus displays the results as a pie chart. The closer numbers are to the red center circle on the chart, the more likely the crop would respond to that nutrient.

“Nutrition on the whole looked good,” Bower explained. “I would have liked potassium levels to have been higher. The nitrogen to sulfur ratio at 17.2 to 1 was good. Manganese was a little low. As soils dry, manganese and potassium often go hand-in-hand regarding being low.”
After harvest, the grower reported the field yielded just under 70 bushels per acre. The southeastern corner is more rolling. The area where Bower pulled samples pushed 80 bushels per acre.
About the Author(s)
You May Also Like


