November 17, 2017

Think Different
· Use grid-based soil sampling as the base for your fertility program, not the final arbiter.
· Seek out regional data for use when analyzing farm data to identify broader trends and more correctly evaluate low soil test readings before making applications.
· If you don't have the expertise, partner with a precision ag supplier who can aggregate data and assist with multiple overlays to fine-tune recommendations based on multiple types of data input.
---------
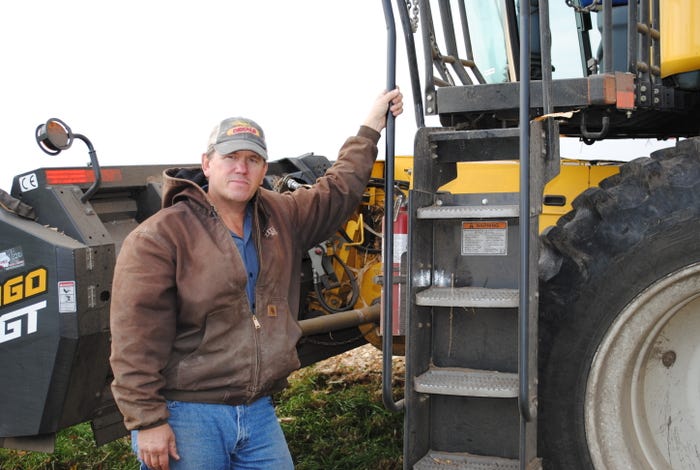
With 20 years of grid-based soil sampling under his belt, Iowa farmer Pete Jahr knows what the methodology can do and what it can't. He also recognizes that it is only the beginning to understand his soils and how to best utilize them. His local CHS co-op agronomist, Paul A. Trcka, puts the test results in perspective. The corn and soybean grower from St. Ansgar has worked with Trcka even longer than he has used three-acre grids.

"Paul brings a knowledge base with him," says Jahr. "I'm one farmer, and he has data from farmers across a 30,000-acre area around me. He can put the information from all those acres together to identify trends on pH, phosphorous (P) and potash (K)."
Regional weather impacts tests
That kind of database, gathered over time in particular years, is valuable when interpreting soil test results, notes Antonio Mallarino, professor, Soil Fertility Research and Extension, Iowa State University. "Weather effects on soil tests are not confined to one field, but are regional," he says. "For example, if potassium seems lower than it should be in one field but not others, then weather is not likely the problem. If area values are all coming in low, then you can make a better decision on whether to apply more potassium."
One deciding factor is trend lines. Again, a broader database can provide perspective, especially if the farm lacks sufficient data points to validate a trend. Jahr samples a quarter of his farm each year, which gives him five data points per sample site. Mallarino would like to see farmers sample their soil more often, especially given the cost of seed, fertilizer and equipment.
"This is especially true when adding a new field or when making changes such as tillage," he says. "Many things happen over four years that can impact soil test results."
Sampling methods key
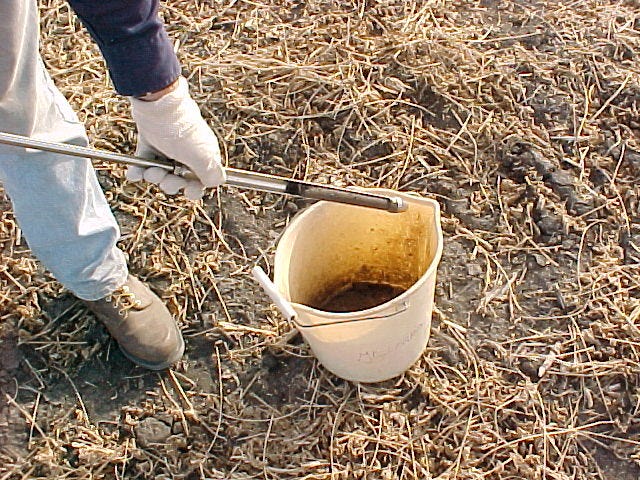
Perhaps even more important is the quality of the sample. That includes the number of cores gathered. Mallarino recommends at least 10 to 12 at a radius of 50 to 60 feet. His research shows clear advantages to correctly done grid sampling versus zone type or soil type, citing problems with variability over time and repeatability. That said, he acknowledges the value of soil and yield maps as overlays, especially if the yield map provider can produce indexes of low, medium and high yield levels based on multiple years of data.
"You can improve on grid sampling with a soil type overlay. Look for points that may be in the boundary of contrasting soils before sampling, then move your sample sites to one side or the other, " says Mallarino. " If you have an indexed yield map, you can vary the amount recommended for maintaining nutrient levels. This is especially important in a dry year when variability can be tremendous."

It's a recommendation that Jahr and his agronomist Trcka endorse. Jahr has been collecting yield data since 1996; however, he only relies on the past five to six years as being the most relevant. "You can get too much data," says Jahr. "Paul incorporates yield maps, soil maps and soil tests into his program – it's what he and his team are good at."
When there is enough variability in a field, Trcka prepares variable rate planting maps. VRT applied P, K and lime are also based on the aggregated data.
"If a field will hit a home run year-in and year-out yielding 240 to 250, we'll apply P, K and lime to make the yield," says Trcka. "If it has sandy areas and only hits 120, we back off."
Target losses with profit maps
Trcka has also done profit maps, showing where Jahr is making money and where he is losing money so needed changes can be made. Spending is not recommended without a projected return. For example, Trcka has compared fertilizing by EC zone versus grid samples and found no increase in yield, only extra costs – information he passed on to Jahr.
"Pete did some EC zone based work for a few years, but we asked him what he was learning?" recalls Trcka. "The question we ask about any practice is does it pay?"
In the case of EC mapping, two things come into play. One is the cost, and the other is the need. "In our counties we have fairly current soil surveys," explains Trcka. "You can lay an EC zone over a soil survey, and it is amazing how closely they match."
"With costs where they are, we have to fine-tune everything," says Jahr. "That's why we grid sample, so we're not putting fertilizer where we don't need it."
That holds true for nitrogen as well. While P and K and lime are fall applied, N is split applied in the cropping season. Jahr uses CEC field averages from his soil testing to set preplant rates. With a CEC of 10, the field will get 100 units to start and a follow-up of 60 to 70 units from anhydrous at sidedress, depending on yield goals. If the CEC is 15, it will get 150 units of 32 percent to start with and more at sidedress based on yield goals. Using the CEC field averaged, while he is actually applying more N today than ever, he is increasing utilization and reducing loss with the split application and field specific applications.
“We know our soils can only hold so much N in place without leaching, so it is important to not put out too much at once,” says Jahr. "The next step down the road will be VRT nitrogen."
About the Author(s)
You May Also Like


