November 19, 2018

By Cory Walters
Farm financial health can be improved through better understanding of market forces influencing the optimal crop insurance contract and preharvest hedging.
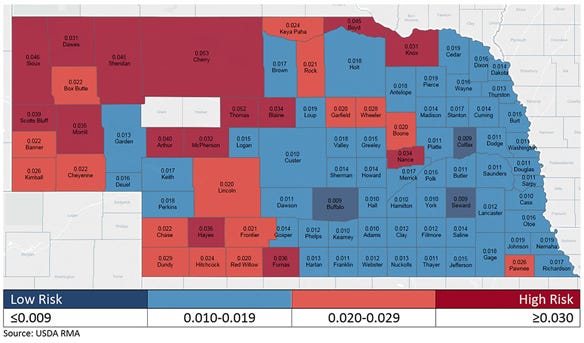
One challenge is assessing risk exposure, since experiencing risk is, by default, rare. A producer’s location is a primary factor influencing risk exposure. In Figure 1, the blue and dark-blue counties have a lower yield risk level than the state average yield risk, while orange and red counties have a higher yield risk than the state average. Crop insurance premiums are generated using the values in Figure 1.

FIGURE 1. The blue and dark-blue counties on this map indicate a lower yield risk level than the state average. Orange and red counties indicate a higher yield risk than the state average.

By identifying financial risk exposure, growers can identify their optimal crop insurance and preharvest hedging level.
For example, consider irrigated corn in Saunders and Custer counties — separated by about 175 miles. This analysis is conducted at the county level, implying farms within the county will likely experience different outcomes. However, farms with acreage spread across a county will be more similar to the county analysis found here.
To make a risk management decision, the decision-maker must have clear objectives. In this case, the two objectives are to maximize net income and minimize probability of farm failure. Any risk management strategy that increases the probability of farm failure is no longer considered. Risk management strategies that result in a lower-expected net income than an alternative are less effective and no longer considered.
Net income risk exposure
Three factors contribute to net income risk exposure:
• Yield risk. In this analysis, the yearly de-trended county average yield over the previous 34 years is used to describe yield risk. The year 1993 was the worst irrigated yield in the time series, due to a wet spring followed by a cold August.
• Futures price risk. Futures price risk is represented by the price volatility factor and defined as the change in December futures price between March first and December first because these dates correspond to the crop planting decision, projected price determined by the Risk Management Agency, and the December futures expiration, which is just after harvest.
• Yield price correlation. Another source of risk exposure, and one that is often overlooked, is the producer's underlying relationship between yields and prices. The negative relation between yields and prices is commonly referred to as the "natural hedge." The drought of 2012 was an example of the natural hedge, where drought lowered expected yields and prices responded by moving higher.
Revenue Protection (RP) and Revenue Protection Harvest Price Exclusion (RP-HPE) are considered because they both insure price but in different ways. For preharvest hedging, consideration should be given to hedge-to-arrive contracts with a 10-cent-per-bushel initial contract fee, a 10-cent-per-bushel buyout fee and the dollar amount from being in an oversold position with a lower contract price than the fall price.
It is easy to identify the costs of risk management through crop insurance premiums and preharvest hedging costs. The difficulty comes in identifying risk exposure because low-yield events do not occur often, and the yield price correlation can be difficult to represent.
The historical yield-price correlation is -0.35 in Saunders County and -0.22 in Custer County — suggesting that moving west away from the Corn Belt results in a weakening relation between yield and price. A lower yield price correlation implies the producer in Custer County faces more net income risk than those closer to the Corn Belt in Saunders County.
Crop insurance contract type
The optimal insurance contract for both counties was RP-HPE. That's because RP-HPE has a lower premium and similar reductions in risk exposure than RP.
RP-HPE is often overlooked as inferior compared to RP, since RP-HPE doesn't protect against higher fall prices. In an event with higher prices (2012 drought), only yield losses trigger crop insurance indemnity payments.
The question then becomes, will an irrigator face the possibility of indemnity payments when higher prices occur? A primary role of irrigation is to protect yields against drought. The combination of experiencing higher prices with a loss in an irrigated production practice in the same year generates a rare combination of events.
However, before adopting RP-HPE, there are a few reasons a farmer may want to stick with RP:
• Crop insurance does not allow for separate insurance types (RP or RP-HPE) between practices (irrigated vs. non-irrigated). Having RP-HPE when nonirrigated corn is in the production mix can be problematic, especially as the ratio of nonirrigated to irrigated corn grows.
• Facing the threat of losing irrigation water during a drought improves the chances of an irrigated loss and places more value on having RP over RP-HPE.
• If the producers’ acreage is contained to a small area, the threat of a lower farm yield through hail or wind increases, also implying a higher value for having RP.
Crop insurance coverage level
Results indicate 85% coverage level as optimal with 80% following closely. Identifying the highest coverage levels as being optimal is a function of our objectives, to minimize a rare event that could result in farm failure. If short on capital, select the higher coverage level, knowing your expected income goes down (due to a higher premium), but the probability of survival increases due to protection provided by crop insurance.
Preharvest hedging
With no insurance, hedging past 70% of expected yield begins to increase risk in Custer County, while hedging past 60% of expected yield in Saunders County begins to increase risk. The opportunity to hedge in irrigated production without insurance is driven by a lower yield risk.
Any amount of hedging up to the point of increasing risk is optimal. A producer who places a low chance on a low price to occur in the fall will hedge less — maybe zero. A producer placing a high chance on the low price to occur in the fall will do more hedging. A smaller maximum on the level of hedging in Saunders County is a result of the stronger yield price correlation. Remember that a stronger yield price correlation means less net income risk, and therefore less need to protect against bad events.
Insurance and preharvest hedging
What does buying an optimal crop insurance policy do to the optimal amount of hedging? For irrigated corn, buying an optimal crop insurance policy (RP-HPE at 85% coverage level) reduces the maximum amount of preharvest hedging in Custer County from 70% to 40%, and in Saunders County from 60% to 25%. This indicates substitutability between crop insurance and hedging.
Devising a risk management plan requires not only understanding how the risk management policies work, but more importantly, having a clear set of objectives and knowledge of the risk exposure. This county analysis suggests the optimal risk management plan can vary due to risk exposure.
In this situation, with irrigated corn production, the RP-HPE insurance policy at high coverage levels is optimal. However, farm characteristics that increase the chance of yield losses in years with higher fall prices can mean RP is the optimal policy.
A declining yield price correlation, which implies more net income risk, suggests a higher maximum amount of preharvest hedging before hedging starts to increase risk. Going from Saunders County to Custer County increased the maximum hedging level by 10 percentage points.
These results are specific to the crop and practice. Changing crops or practices can result in a different set of optimal contracts or hedging levels.
Walters is an assistant professor of agricultural economics at the University of Nebraska-Lincoln.
You May Also Like


