Subscribe to receive top agriculture news
Be informed daily with these free e-newsletters

Better distribution of manure nitrogen can help reduce the need to apply supplemental N as sidedressing in spring, thus resulting in cost savings and water quality benefits.
Liquid manure application in Iowa from livestock operations typically happens in spring and fall each year. Liquid manure application to fields is a method of supplying nutrients to the crop grown subsequently. The majority of liquid manure application takes place using a tank or a dragline applicator.
Tank applicators transport manure from the livestock facility to farm fields when distances are great and apply manure using a tank-mounted toolbar. For some fields that are close by, manure can be pumped directly to the dragline-mounted toolbar. In either case, a predetermined application rate is used to pump manure through a manifold, which distributes manure to the application points across the toolbar.
Environmental regulations require producers to make sure manure is being applied to fields in accordance with their approved manure management plans. It is important to ensure that the nutrients for use by the crops are not being applied excessively or scarcely. Variations in tank capacities, manure densities and presence of foam can all cause the application rate to be different from the target number. Variations in drive speed can also cause the application rate to be different. Thus, your application rate should be verified, and both tank and dragline applicators need to be calibrated to ensure accurate application.
Calibrate your application rate
Calibration of application rate, in terms of gallons per acre applied, can be achieved using an area volume method. For applicators without automated controls, the volume of manure applied in a given pass should be determined. Knowing the density of the manure and area covered in the pass, the application rate can be determined. Changes to drive speed can be made to achieve calibration such that the target manure application rate is achieved.
There are manure applicators that use tractor-mounted automated flow controls to achieve accurate application rates. In these cases, flow controllers use a flowmeter with an actuator to govern the flow rate and subsequently the application rate. The majority of flowmeters are set at the factory for their rated measurements, which can potentially be different when used for manure application. The flowmeters should be verified to ensure that they are providing correct flow-rate readouts to the flow controls.
Secondly, the accuracy of GPS should also be verified to ensure the controls are accurately determining the drive speed and subsequently the area covered, or else the application rates will not be accurate. Further details on the area volume calibration method and validation of automated controls are provided in ISU Extension publication AE 3601A, “Calibrating Liquid Manure Tank Applicators.”
Aim for better distribution
Achieving calibration of the target application rates only provides an average amount applied on a per acre basis. This application rate is delivered to the manifold mounted on the toolbar, which then distributes the manure to the application points. This distribution of manure across the toolbar swath should be uniform so the variability among application points is minimal. This distribution should be verified only after calibration for the application has been completed.
Split manure application, manure application to soybeans, high total nitrogen testing manures, and use of Maximum Return to Nitrogen Rate Calculator (MRTN) can all cause manure application rates to be lower than what was previously being used. These application rates can potentially be in the range of 2,000 to 3,000 gallons per acre and may even be lower in certain cases. Under such low application rates, the manifolds used for distribution may not be fully pressurized. This can potentially lead to variability across the manifold outlets and subsequently the toolbar application points.
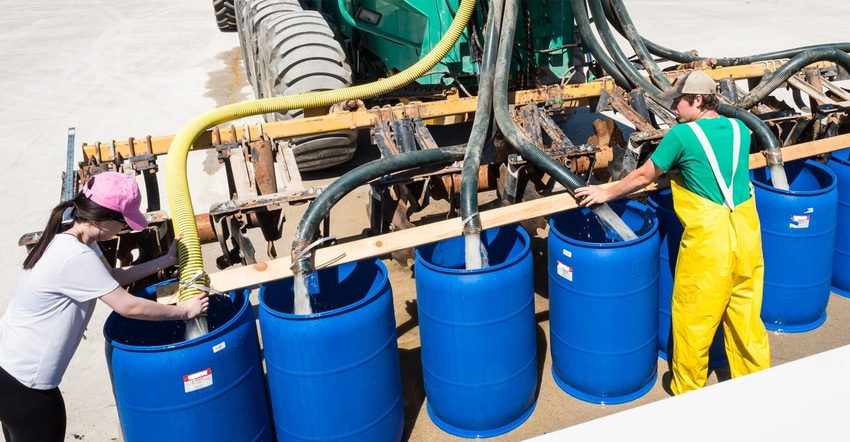
Distribution across the toolbar points can be verified by capturing the discharge from each point for a known time. Care should be taken to set up the equipment as close to field conditions as possible (see photograph). Ideally, the discharge captured should be the same from each application point resulting in 100% uniformity. Given that there are several factors controlling how the manure gets distributed, this uniformity is likely to be less than 100%. The uniformity can be measured using the coefficient of variation (CV), a statistical measure of how the application points differ from one another.
Results of ISU manifold testing
In 2015 and 2016, ISU Extension researchers measured the CV for nine different manifolds in a project partly funded by the National Pork Board and in collaboration with industry partners. Six tank and three dragline-mounted manifolds were tested using water under zero, 3% and 6% slope settings to simulate manure application across the slope. Different manifolds were found to have different configurations in terms of inlet size and location, outlet number, size and locations, and manifold chamber capacity.
As such, performance of each manifold is unique to itself. Test results obtained during this two-year project show that each manifold has a different CV under the three different slope settings due to differences in configuration and how the manifolds are mounted and operated.
Improvements in each manifold’s performance can potentially be made by addressing how and where the manifold is mounted, how the discharge hoses are attached from the manifold outlets to the application points, and the drive speed and knife spacing.
Details of the method to measure distribution, manifold testing results and how to make improvements to achieve better distribution of manure are provided in the ISU Extension publication AE 3600, “Distribution of Liquid Manure Application.”
Exercise caution when using these results for liquid manures with different viscosities. Both publications mentioned in this article and additional publications produced by the ISU are online at agronext.iastate.edu/immag.
Verifying applicator calibration and distribution when applying manure to fields will help apply liquid swine manure effectively. Better distribution of manure nitrogen can help reduce the need to apply supplemental nitrogen as sidedressing in spring, thus resulting in reduced costs and more water quality benefits.
Arora is the ISU Extension field agricultural engineer in central Iowa, based in Nevada. Contact him at [email protected]. Andersen is an assistant professor in agricultural and biosystems engineering at ISU. Contact him at [email protected].
You May Also Like
Enter a zip code to see the weather conditions for a different location.


