July 28, 2016

Here is a quick and dirty discussion explaining why I think we could see increased financial stress on Wisconsin dairy farms before the end of the year. The following may not be too scientific, but it is my observation that most people get more pain from a bad year than pleasure from a good year. Especially when the good year proceeds the bad year, people are tempted to get complacent in the good year.
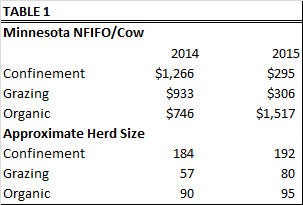
As everyone knows, 2014 was a year of outstanding economic performance for most dairy farms in the U.S. We also know that 2015 was not and 2016 will not be nearly as favorable. We have enough completed data from 2015 to better quantify the differences since 2014 shown in table 1 below.
Net farm income from operations (NFIFO) is the result of subtracting all costs but the opportunity cost of unpaid family labor, management, and equity from total farm income. University of Minnesota data shows NFIFO per cow for Minnesota confinement herds in 2015 declined about 75% from 2014 to 2015. A five-year average NFIFO for these herds is about double the 2015 level. The decline for non-organic grazers was about 70%. In contrast, NFIFO per cow for the Minnesota organic herds doubled from 2014 to 2015.

Looking at several years of data makes it much easier to recognize how much dairy farm income and expenses have changed. Total farm income, milk income, and allocated cost excluding dependent labor per hundredweight sold for five Wisconsin dairy systems from AgFA (Agriculture Financial Advisor) was compared from 1996 to 2013. The five systems are large confinement, the average confinement farm, small confinement farms, organic farms and non-organic grazing farms. The years 2013 was used to represent more recent numbers, because 2014 was such an unusual year, using 2014 alone could provide a distorted picture.
When 2013 is used to reflect current income and expense levels, allocated cost per hundredweight has increased a bit faster or more than farm income per hundredweight sold. When 2014 is used to represent current conditions, farm income and allocated costs have increased at roughly the same pace for most of these groups.
It is also likely that many dairy farms financial performance in 2013 was similar to 2015 and will be in 2016.Consequently, I expect an increase in farm financial stress among Wisconsin dairy farms before the end of 2016.
2016 should be better than 2009, but like in 2009 when profit margins are thin to negative, farms best able to survive the financial stress are those with the highest levels of solvency. Farms that have high levels of assets with minimal debt are best able to survive because they can convert their solvency into liquidity by borrowing money to pay expenses on time. Businesses that operate long enough without profitability will eventually use up all of their assets. In the short run, a strong solvency position provides a tremendous economic advantage.
The farms most likely to be in a weak solvency position include newer farms, farms that have recently made major capital investments and any farms that experience financial struggles most years. All farmers are urged to be especially cautious about new investments and closely monitor their financial performance quarterly or more often at least until conditions improve.
Kriegl is a farm financial analyst emeritus with the UW Center for Dairy Profitability.
About the Author(s)
You May Also Like


