

Subscribe to receive top agriculture news
Be informed daily with these free e-newsletters

2016-- Here is a look back at how land value trends and input costs fell for a third year.
December 19, 2016
This is the second of a two-part article highlighting what happened agriculturally in 2016. Last week’s article provided a review of 2016 crop production and weather conditions. This week, the focus is on livestock profitability, input costs, grain prices, and land value trends in 2016 ……
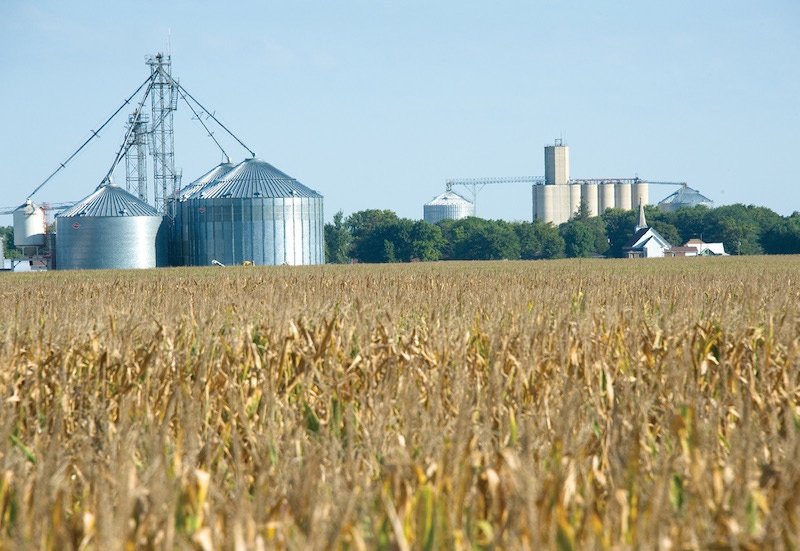
--- Average crop input costs in 2016 were slightly lower than 2015 levels in most instances, marking the third straight year that input costs have shown a modest decline. Fertilizer and fuel costs have shown the greatest decline, while seed costs have remained steady, and chemical costs have actually increased slightly. Corn drying costs in 2016 were relatively low in most areas of the Upper Midwest, due to the favorable growing season and manageable Fall harvest weather. Land rental rates in most areas of the Upper Midwest were steady to slightly lower in 2016; however, many average land rental rates were still higher than breakeven levels for some crop producers in 2016.
Feed costs for livestock producers remained quite manageable during 2016, and other production expenses remained fairly steady. Agriculture interest rates, both for operating loans and longer term loans, remained quite low in 2016; however, there were indications late in the year that there could be a slight adjustment upward in the coming months. The Federal Reserve recently made a modest increase to the prime interest rate, which is used to set local interest rates.
--- Local cash grain prices in southern Minnesota started 2016 at about $3.25-$3.35 per bushel for corn, and from $8.00-8.25 per bushel for soybeans. Local cash prices increased to near $3.70 per bushel for corn, and over $10.50 per bushel for soybeans by mid-June this past Summer. Regional cash grain prices are just over $3.00 per bushel for corn, and near $9.50 per bushel for soybeans, as we end 2016. New crop prices for the Fall of 2017 at local grain markets are currently near $3.25 per bushel for corn and close to $9.40 per bushel for soybeans. Average breakeven grain prices in southern Minnesota for the 2017 crop year, based on average crop yields, input costs, and land expense are expected to be near $3.75-$4.00 per bushel for corn, and near $9.00-$9.50 per bushel for soybeans.
--- Based on the latest “Iowa Land Value Survey” in November, 2016, which is published annually by Iowa State University, the average value of tillable farm land in Iowa was $7,183 per acre, which is a decline $449 per acre, or 5.9 percent from a year earlier. The average value of Iowa farm land has now declined three years in a row, which is the first time that this has occurred since the 1980’s. Iowa farm land values have now declined 17.5 percent from the peak average value of $8,716 per acre in 2013. Average land values rose dramatically from 2004 to 2013, due to the ethanol boom, record farm incomes, and low long-term interest rates. Much lower farm income levels in the past couple of years have caused land values to modify from the peak values in 2013.
--- A continual pattern of low profit margins throughout most of 2016 is significantly impacting the “bottom-line” for most hog, beef, and dairy producers. Farrow-to-finish hog producers showed minimal profit margins during the first half of 2016; however, profit margins have pretty much turned negative in the second half of the year. Wean-to-finish profit margins have been negative throughout most of 2016, with average losses of $30 to $45 per head. Based on data from Iowa State University, the current total cost to take a hog from weaning to market weight is about $65.00 to $70.00 per cwt. of lean carcass weight, which compares to carcass market hog prices of less than $55.00 per hundredweight (cwt.), or less than $40.00 per cwt. on a live weight basis, in the fourth quarter of 2016. Hog producers have faced very low or negative profit margins for the past 18 months.
2016 has also been a very negative profitability year in the cattle feeding industry, with losses of $100 to $300 per head or more, common throughout much of the year. Total production costs for finishing cattle eased somewhat as the year progressed, due to significantly lower costs for feeder cattle, compared to earlier in the year, as well as some decline in feed costs later in the year. Fed cattle market prices have between $105 and $120 per cwt. during the second half of 2016, which have been well below average break-even market prices of approximately $125 per cwt. Similarly, profit margins for beef cow/calf producers have also gotten much tighter during 2016, with the current price for 500-600 pound calves near $175 per cwt. at most locations, compared to over $250 per cwt. earlier in the year.
Dairy producers also experienced negative profit margins throughout first half of 2016, with average milk prices below the average breakeven price level of approximately $18.00 per cwt. for most producers. However, milk prices have improved in recent months, allowing some dairy producers to show a small profit. Poultry production rebounded nicely in 2016, following the major production losses in 2015 that resulted from the devastating Avian Flu outbreak in many areas of the Upper Midwest. The bad news for the poultry industry is that the industry is now dealing with excess supplies of eggs, turkey, and other poultry products, which has driven down market prices.
You May Also Like
Enter a zip code to see the weather conditions for a different location.


