May 8, 2018

Source: Agricultural Economic Insights
By David Widmar
With planting underway, attention will quickly shift to the U.S. growing season and yield outlook. The first debate about yields will likely get underway later this week when the USDA’s releases its May WASDE report. Once corn yield projections get started, Brent and I find ourselves asking “wait, what is corn’s trend yield this year?” With that in mind, this week’s post is 2018 corn yield guide to help navigate the next 6+ months of yield forecasts.
U.S. Corn Yields
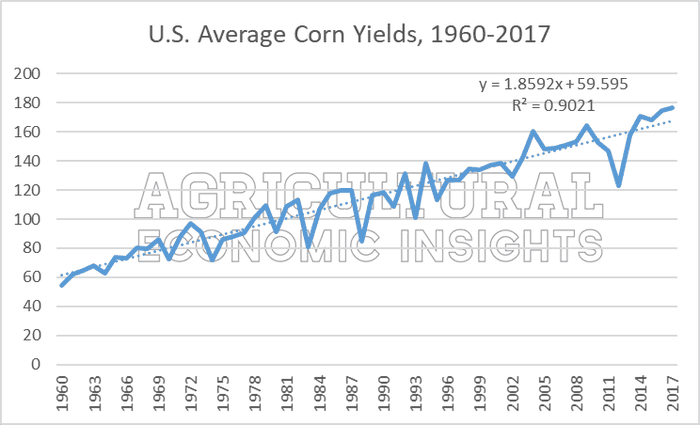
Figure 1 shows U.S. average corn yields from 1960 to 2017. Also included is the trend-line of these yields. Since 1960, corn yields have increased at an average annual rate of 1.86 bushels per acre per years. As we have written about earlier (here and here), yields in recent years have been good. Specifically, there have been four consecutive years of above-trend corn yields.

Figure 1. U.S. Average Corn Yields, 1960 to 2017.
Table 1 shows the data points from Figure 1. The first column shows reported yields (the solid blue line in figure 1) while the middle column is modeled trend yields for each year (the dashed trend line in figure 1). The third column is the difference between the reported yield and trend yield.
The departure from trend allows us to compare yields over time. This can be difficult to do given the upward trend in yields over time. Take 2004 as an example. That year corn yields were a record-shattering 160 bushels per acre. That 2004-yield of 160 looks quite unimpressive today, given 170+ bushel yields of recent. The departure from trend, however, allows 2004’s 17 bushels above trend yield to be compared over time.
For 2018, trend yield is 169.3 bushels per acre.

Table 1. U.S. Average Corn Yields, Trend Yields, and Departure From Trend. 1960 to 2017.
What Might 2018 Have in Store?
While the trend yield for 2018 is 169.3, this single data point, alone, doesn’t tell us much. It is important to think about the range of yields that might be in store for 2018. Using 2018 trend yield and historical departures from the trend, we can take a close look at what might be in store for 2018.
The data in table 2 are sorted by the departure from trend (same data from Table 1). These departures from yield data were then added to 2018’s trend yield (169.3 bushels per acre) to provide additional insights into where 2018 yields might fall. For example, corn yields in 2004 were +17 bushels above trend. With a trend yield of 169.3, a repeat of 2004-like conditions would be more than 186 bushels per acre in 2018.
Table 2 can serve as a benchmark as yield estimates are made throughout the growing season.
Table 2 also provides a few additional insights. A dark line was added between 1989 and 2000 to mark the mid-point of observations. Half of the observations lie above this line, while half of the observations lie below this line. This clearly shows that more than 50% of the observations have been above trend (departure from trend greater than 0). This is a critical point. Historically, yields have not been above-trend 50% of the time. Instead, corn yields have a been above trend 60% of the time.
While the 2018 trend average yield is 169.3, historical departures from trend provide us with some insights as to what might be in store. Specifically, a corn yield in 2018 of 180 bushels per acre or more – which would be devastating for prices- would equal a departure from trend of more than 10 bushels. Historically, yields 10 bushels above trend, or higher, have occurred eight times (14% of the time). On the other hand, yields more than 9 bushels below trend, or less than 160 bushels in 2018, have occurred 16% of the time historically. This is to say that, while the trend yield is nearly 170 bushels, there could also be a lot of variation around that trend average.
Table 2. Corn Yield Departure From Trend. 1960 to 2017.

A Few Other Points
First, while recent yields have been strong and above-trend, from a historical context, they have not been record-shattering. Corn yields in 2017 were 9.2 bushels above trend, of the 10th largest above-trend year.
Second, with four consecutive years of above-trend yields behind us, it is important not to conclude a below-trend year is “due.” We wrote about this last year (here). Statistically, it is a low probability event to have 4 (or 5) consecutive above-trend years, but that does not necessarily impact the outcome for 2018. In our minds, yields are like flipping a coin, where each flip is independent of the previous flips. Even though flipping numerous consecutive “heads” is a low probability event, each flip is independent of the previous flips and a 50:50 odds. This is all to say, be careful if you are 2018 marking plan is based on below-trend national yields.
Wrapping it Up
With summer on the way, speculation about corn yields will soon be in full swing. It is important to carefully consider historical data and trend yields before jumping to conclusions about the 2018 corn crop.
For 2018, the trend average is 169.3 bushels per acre. The idea of an “average” crop being nearly 170 bushels per acre- a level first reached in 2014- will be important to keep in mind.
Outside of the trend yield, it is important to consider the full range of possible yields. For example, historical departures from trend suggest yields below 160 and above 180 could be possible in 2018.
Originally posted by Agricultural Economic Insights.
You May Also Like


