February 24, 2018

Losing $13 per acre (variable costs only) from growing wheat may result in losing a farm. It could be time to find alternative crops.
Another alternative is to develop a crop rotation system that will break weed, disease, and insect cycles to reduce costs.
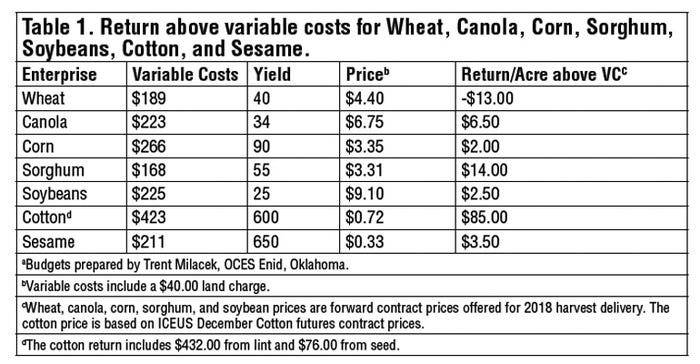
Estimated costs and returns from potential alternatives are shown in Table 1. The procedure used to develop the table may be more important than the information presented. No two farms, or even fields, will have the same costs and returns. Plus, the one thing known with certainty is that price and yield estimates will be wrong.
Alternatives to wheat include canola, corn, cotton, sesame, and soybeans (Table 1). Costs are estimated for the Alfalfa, Garfield, and Kingfisher county areas. Yields are based on 20-year averages (1997-2016).

Except for cotton and sesame, the price is the harvest forward contract price being offered by grain handlers. The cotton price is based on the ICEUS December 18 cotton contract price adjusted to the Oklahoma/Texas area. The sesame price is the current Sesaco contract price for full season production.
COSTS VS. RETURNS
The calculated net returns per acre above variable costs are minus $13 for wheat (note that the breakeven yield is 43 bushels at $4.40, or $4.73 at 40 bushels), $6.50 for canola, $2 for corn, $14 for sorghum, $2.50 for soybeans, $85 for cotton, and $3.50 for sesame.
It is a no brainer: Cotton is the logical choice, right?
These results are based on averages. If you have one foot in a bucket of ice and the other in a bucket of hot coals, on the average you’re comfortable.
A first look at risk is the cost of production. Variable costs are wheat $189, canola $223, corn $266, sorghum $168, soybeans $225, cotton $423, and sesame $211. From a cost basis, sorghum has the least risk, and cotton has two and a half times more risk than sorghum ($168/$423).
What about yield risk? Twenty years of yield data for Alfalfa, Garfield, and Kingfisher counties are used to calculate a risk rating (1 to 100 — the higher the number, the greater the risk).
Wheat has a risk factor of 24, corn 43, sorghum 33, and soybeans 36. Historical yields were not available for cotton or sesame. I would guess that cotton yield risk would be equal to or greater than soybean yield risk. (Note that corn has 30 percent more yield risk than sorghum ((43-33)/33 = .30). The risk is even higher when you consider that it costs $266 to produce corn, compared to $168 to produce sorghum.
PROPENSITY FOR RISK
A side note: Yield data was provided by USDA/NASS. Some county averages were unavailable because producers had failed to fill out and return their annual yield surveys. NASS cannot publish the data unless a certain number of surveys are returned. This data is invaluable in conducting research both by institutions and producers.
The lowest county average yield for a single year was 14.4 bu. for wheat, 32 bu. for corn, 18 bu. for sorghum, and 10 bu. for soybeans. These values may be used to determine the maximum loss that could be expected.
Which cropping alternative would work for you depends on your propensity to take risks, the equipment you have to complete the production process, and which crop you feel the most comfortable growing.
About the Author(s)
You May Also Like


