January 27, 2020

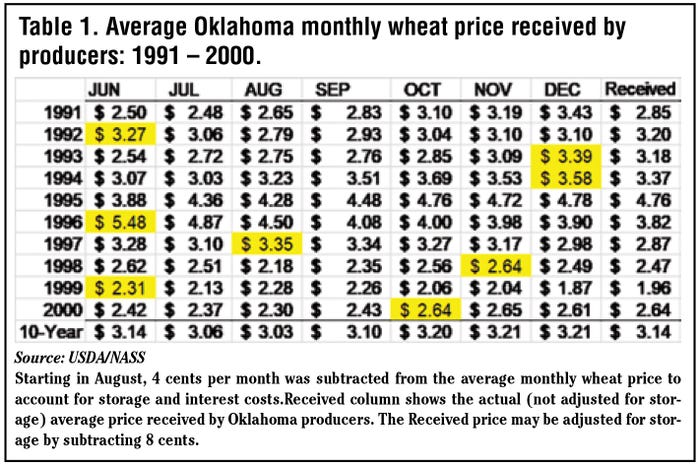
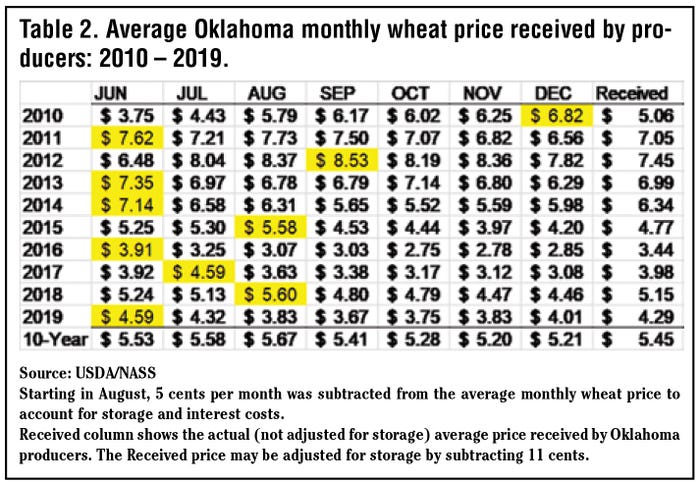
Twenty years ago, the recommendation for selling wheat was to store wheat and sell it during the October through December time period (Table 1). An alternative was to sell wheat in lots of one-third: 1/3 at harvest, 1/3 in October, and the final 1/3 in the November/December time period. Now the recommendation for selling wheat may be to have sold the wheat by September 1 of each year (Table 2).

In the following analysis, the assumption is that wheat was placed in commercial storage at harvest and that storage costs began August 1. For the 1991 through 2000 time period, commercial storage and interest costs are assumed to be four cents per bushel per month.
For the 2010 through 2019 wheat marketing years, storage and interest costs are assumed to be five cents per bushel per month. (If storage costs start in July, subtract another four or five cents from the prices, starting with July.)
Another assumption is that the wheat was sold before January 1 of each year. On average, 77% of Oklahoma’s wheat has been sold by January 1. Not shown in the tables is that, for the years shown, the best times to sell wheat after January 1 were in 1991 (February), 1995 (May), and 2010 (April).
If wheat had been sold in the same month every year throughout the period 1991 through 2000, the monthly average price received would have been $3.14 for wheat sold in June. Wheat stored and sold in October, November, or December, netted an average price of $3.21.
Between 2000 and 2010, the wheat price pattern changed. A major cause of the change was increased Russian and Ukraine wheat production and exports. For the five-year average for the years ending in 2000 and in 2019, Russian and Ukraine wheat production increased from 1.78 billion bushels in 2000 to 3.67 billion bushels in 2019. Wheat exports increased from 103 million bushels to 1.9 billion bushels.

During the 2010 through 2019 wheat marketing years, Russian and Ukraine wheat was mostly exported during the September through February time period. This situation tended to lower the world’s September through January wheat prices relative to June through August prices, which caused the change in Oklahoma and Texas wheat price patterns.
During the last 10 marketing years (2010 through 2019), the best months to sell wheat were June, July and August (Table 2). The average price for June was $5.53. For July, the price was $5.58, and for August, it was $5.67.
From 1991 through 2000, the best time to sell wheat was during the October through December time period, and on-farm storage made this strategy more profitable. After 2010, having on-farm storage did not change the best time to sell wheat.
One consistency for wheat price patterns, shown in both tables, is that the best time to sell wheat is rarely after January 1. This research indicates that to maximize the odds of selling wheat at the top of the market, wheat should be sold before September 1.
About the Author(s)
You May Also Like


