Subscribe to receive top agriculture news
Be informed daily with these free e-newsletters

Problems in the Corn Belt are just starting to show up on satellite imagery, while the advanced maturity of the winter wheat crop is quite evident.
Farm Futures has partnered with the Ecology and Agriculture Spatial Analysis Laboratory (EASAL) at Kansas State University to bring these maps to you. Each map is composed from satellite data taken over a two-week period. The EASAL maps show current vegetative health for the past two weeks and compare vegetative health with the previous two-week period, with the previous year and with the long-term average. Green reflects healthy vegetative development, while brown reflects a lack of healthy vegetative biomass production. Maps in this latest report show the impact of hot, dry weather on the winter wheat crop, but better conditions in the Eastern Corn Belt.

Satellite imagery shows active vegetative growth on the West Coast and in many areas of the eastern half of the Lower 48 states. However, a lot of cropland soil continues to show through across many of the primary corn growing areas of the Midwest.

Rapid maturing of the winter wheat crop shows up as poorer vegetative health in the central and Southern Plains, relative to the long-term normal for late May, along with weaker vegetative health in the Mid-Atlantic. Much of the Midwest is a mixture of better and poorer crop health than normal for this point in the growing season, with no clear trends showing up yet, depending on where rains have fallen. The Mid-South shows a bit better vegetative health than normal.

The most significant differences from mid-May are the dramatic dry-down of the winter wheat crop in Kansas and the deterioration of vegetative health in the mid-Atlantic.

Vegetative health relative to the previous year is really quite variable across much of the country. The Great Lakes area and much of the Ohio Valley appear much healthier relative to the previous year, where scattered dryness is beginning to impact crop health in other portions of the Midwest and South. Poorer vegetative health in the central and Southern Plains relative to the previous year is largely tied to the advanced maturity of this year's winter wheat crop in the region.

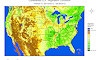
This graphic shows the long-term average vegetative health for this time of year.
You May Also Like
Enter a zip code to see the weather conditions for a different location.


