December 22, 2017

I asked a wheat producer, “What’s on wheat producers’ minds.” He replied, “Moisture! My wheat is stressed and turning blue.” My thought was, “You’ve got a good stand — what else matters?”
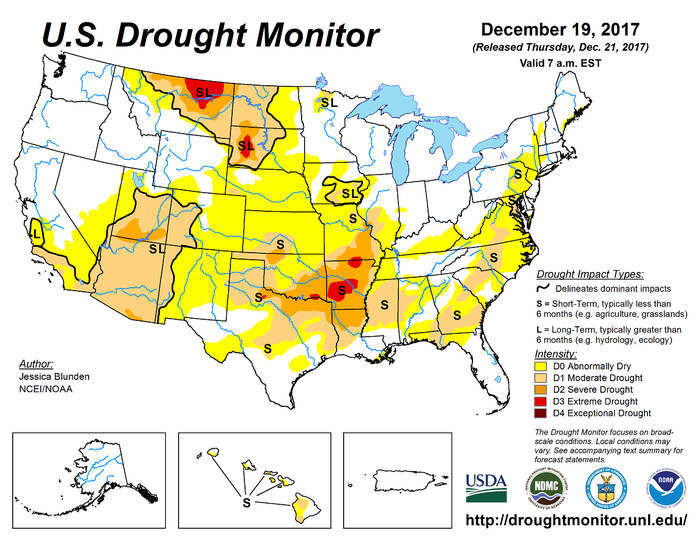
A review of the Drought Monitor (Figure 1) shows that most of the Oklahoma and Texas wheat area is rated Abnormally Dry (D0). The Oklahoma Panhandle and south central Kansas areas are rated Moderate Drought (D1). Recent light rain and snowfall may alleviate some of the moisture concerns.
The question, Do current soil moisture conditions provide an indication relating to potential yields?, is still relevant. The unequivocal answer is: No.
The USDA and NOAA (National Oceanographic and Atmospheric Administration) compile a Drought Severity and Coverage Index (DSCI) that provides an indication of drought severity over a given area. The mid-December Drought Monitor DSCI for Oklahoma was compiled over the 10 year period 2007 through 2016. An analysis of the relationship between the DSCI (soil moisture) and average per acre Oklahoma yields was conducted.
The percentage deviation from the 10 year average was calculated for both the DSCI and Yields. Note that the NOAA DSCI provides information relating to drought (dry) conditions only. Above average moisture conditions are not included in the index.

For two of the 10 years (2009, 2015), soil moisture conditions were not rated in dry or drought conditions. In 2009 (Dec 2010 wheat crop), Oklahoma’s average yields were 5 percent above average. Both years without dry or drought ratings resulted in above average yields. These two years were included in the above average soil moisture years.
The deviation from average DSCI was 145, which would imply a 10 year average rating of Abnormally Dry to Moderate Drought. The corresponding 10 year average yield was 30 bushels per acre.
Note that in Table 1, minus numbers imply drought ratings less than Moderate Drought or below average yields, and positive numbers imply drought ratings at or above Moderate Drought or above average yields.
Table 1. Deviation of Drought Monitor DSCI and Oklahoma Average whet yields (2007-2017)
|
|
|
| Deviation from Average |
|
|
Week | DSCI | Yields (bu) |
| DSCI (%) | Yields (%) |
|
12/11/2007 | 50 | 37 |
| 66 | 25 |
|
12/16/2008 | 95 | 22 |
| 35 | -25 |
|
12/15/2009 | 0 | 31 |
| 0 | 5 |
|
12/14/2010 | 118 | 22 |
| 19 | -25 |
|
12/13/2011 | 253 | 36 |
| -74 | 22 |
|
12/10/2012 | 425 | 31 |
| -192 | 5 |
|
12/15/2013 | 112 | 17 |
| 23 | -42 |
|
12/13/2014 | 201 | 26 |
| -38 | -12 |
|
12/12/2015 | 0 | 39 |
| 0 | 32 |
|
12/13/2016 | 199 | 34 |
| -37 | 15 |
|
12/12/2017 | 186 |
|
| -28 |
|
|
Average | 145 | 3 0 |
|
|
|
|
Source: USDA and NOAA: and USDA/NASS
For example, in December 2012, the DSCI deviation was a minus 192 percent, implying drought conditions near Moderate Drought, and the average yields were minus 5 percent (1.5 bu.). In December 2007, the DSCI was 66 percent, implying less than Moderate Drought conditions, and the yield deviation was minus 25 percent, implying an average 2008 yield of 22.5 bushels per acre.
For six of the 10 years, moisture conditions (drought ratings) were Abnormally Dry or better (above average soil moisture). Yields in 2007(2008 crop) and 2015 (2016 crop) were significantly above average. One year (2009/2010 crop) had slightly above average yields. The remaining three years (2008, 2010, and 2013) had above average moisture and significantly below average yields.
Four of the 10 years (2011, 2012, 2014, and 2016) had average drought ratings, Moderate Drought or higher. Two of the four years (2011/2012 crop and 2016/2017 crop) had significantly above average yields. Only one year (2014/2015 crop) had drought conditions and below average yields.
One conclusion is that non-drought conditions during December may indicate that the odds are above average for above average yields. Another conclusion may be that drought conditions may not imply below average yields.
The message is that as long as you have a stand of wheat in December, inputs should be applied for average or better yields.
About the Author(s)
You May Also Like


