May 30, 2018

Source: South Dakota State University
By Laura Edwards
Many southern area farmers are facing excess moisture again this spring, and some are considering changing varieties to accommodate for a later planting date. The Corn Growing Degree Day (GDD) Tool can help decide if a shorter day variety may be needed.
The Corn GDD Tool uses historical climate data to show you the most likely spring and fall frost dates for your county. In addition to frost dates, the tool will show a graph that includes likely dates for silking and black layer (physiological maturity), given different planting dates and different varieties, for the current growing season. The temperature data at the heart of the online tool is updated every day, so you can see how the current year's accumulated GDD compare to past years. Using climatology and long-term averages, an estimate of when the crop will reach these critical growth stages is presented by the website.
You have many options to select from, including your planting date, maturity, years you would like to use for comparison, and graph display options. The website runs quickly which allows you to compare many scenarios. This way, you can try out some options at any time during the growing season such as calculating an ideal maturity for replanting, or trying to determine the likelihood that your existing crop will reach maturity before fall frost.

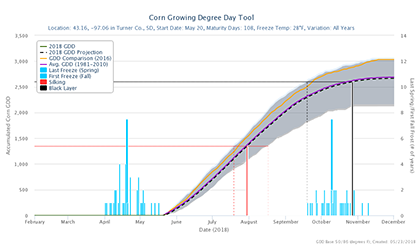
For example, the graphic here shows the data for Turner County, SD as of May 20, 2018. The vertical blue lines indicate historical spring and fall frost dates. The taller blue lines show the median date for spring and fall frost. The light blue shaded areas show the historical range of GDD during the growing season. The dark green line is the current season's accumulated GDD since April 1, and the dotted line uses the historical average accumulations to estimate when the crop will reach silk (red vertical line) and black layer (black vertical line) given a 108-day maturity.
In this graph, a 108-day maturity variety planted on May 20 would likely reach physiological maturity in late October, after the average fall frost. If this is a concern, it is simple to use the options to select a shorter day maturity and change the planting date (start date of GDD accumulation) to find a variety that will mature earlier. The user can re-calculate the GDD, and see if the black layer can be reached at a more ideal date. Another option in the tool is to select individual comparison years. Here, 2016 is chosen with a yellow/orange colored line, so it is easy to see how last year’s GDD accumulation, starting on May 20, compared to what historical average temperature would predict (purple line).
The Corn GDD Decision Support Tool is found at the Midwest Regional Climate Center website.
Originally posted by South Dakota State University.
You May Also Like


