Subscribe to receive top agriculture news
Be informed daily with these free e-newsletters

2017 drainage water in Iowa shows less nitrates with no-till and cover crops, more with tillage and nitrogen inhibitors
June 19, 2018
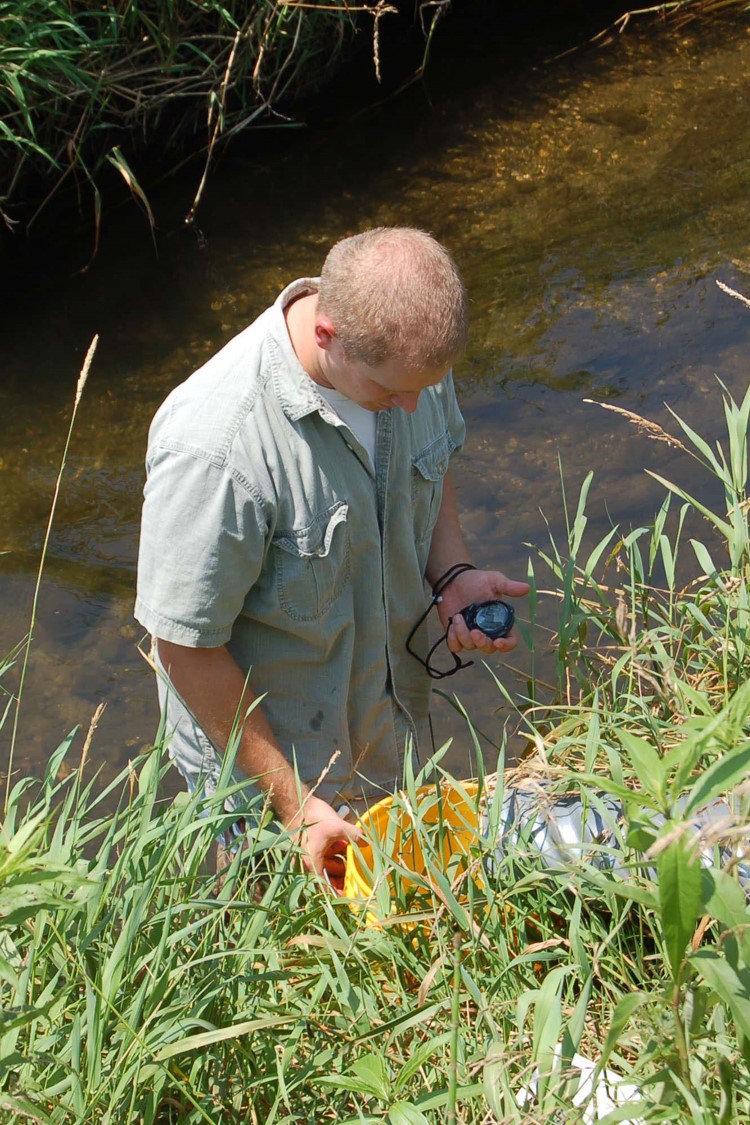
Rather than rely solely on water monitoring results from outside sources, the Iowa Soybean Association staff is building a knowledge base by sampling tile waters for nitrate concentrations on a field scale, reporting back to the farmers involved. ISA gathers samples from volunteer members throughout the growing season and tests the water at a certified water lab housed at ISA headquarters.
---------
At its annual research conference last winter, the Iowa Soybean Association released preliminary findings compiled from water monitoring on 342 drainage tile outlets in 2017. The results came from locations in about half the counties across the state; 75% of the sites had enough flow to include at least 4 samples over the growing season.

Nitrate concentrations from ISA water quality monitoring in 2017 varied considerably, but most samples fell in the 5 to 20 mg/L range.
“The primary reason we’re doing this is to help our members learn more about the water quality on their farms,” says ISA Water Resources Operations Manager Adam Kiel. “All individual results are given only to the participant, but we do aggregate the results so each participating farmer can compare the results from their farm against others in the program.”
Management information such as tillage, nitrogen applied, and cover crops use was gathered for the fields draining to each monitoring site. “Having that management information on numerous sites allows us an opportunity to observe how management may have affected nitrate levels,” Kiel says.
One observation Kiel and ISA Environmental Research Coordinator Tony Seeman made was fields with fall and spring tillage had significantly higher nitrate concentrations than no-till fields. They didn’t find any differences in nitrate concentrations based on nitrogen application timing. Surprisingly, they found fields with anhydrous ammonia applied in the spring with nitrogen inhibitors had higher nitrate concentrations than those without inhibitors. They also found bioreactors reduced nitrate concentrations by 43%.

As expected, nitrate-N concentrations yields peaked in the spring, when more water was flowing through tile.
The average nitrate concentration in water leaving all fields was 13.1 mg/liter.
Water from corn fields had slightly higher concentrations of nitrate (13.9 mg/l) than from soybean fields (11.1 mg/l).
For the second year in a row, there was no strong correlation between the amount of nitrogen applied and the concentration of nitrate in water, on fields fertilized within normal nitrogen rate ranges. “We continue to see the system is driven by something other than rates of nitrogen applied,” says Seeman, who is heavily involved in water monitoring for ISA.
Cover crops use showed water quality benefits. On average, fields with cover crops showed nitrate concentrations of 9.5 mg/l compared to 14.2 mg/l in fields without cover crops use. The difference amounts to a 15-pound/acre reduction in nitrate load in the water when interpolated over 6 months.
One-sixth of the sites monitored contributed half the total nitrate loss.
You May Also Like
Enter a zip code to see the weather conditions for a different location.


