Subscribe to receive top agriculture news
Be informed daily with these free e-newsletters

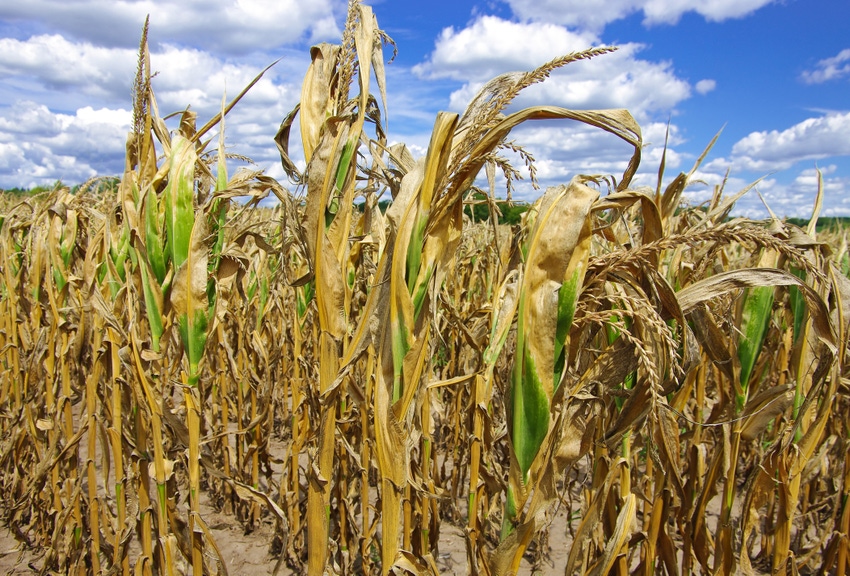
Data from 2017 show stored soil water and shallow ground water accounted for up to 46% of total grain yield.
January 13, 2018
Source: Iowa State University
Most of Iowa was wet and cool during planting last year (end April to mid-May), warm and dry during vegetative growth (June to July), and cool and wet during reproductive development (August to September). In some locations, the June-July drought was severe with precipitation deficits exceeding eight inches. Despite this drought, yields were high and above the long-term trend for a third straight year.
In-season rainfall is not the only source of water for crops in Iowa. Stored soil water and shallow groundwater were significant contributors to total water uptake. For this reason, crops survived the June-July drought. Field measurements revealed that the depth to water table was approximately five to six feet below the soil surface in mid-July (corn silking time) and crop roots had reached that depth. Deep roots and shallow water tables compensated for much of the precipitation deficit. In fact, below normal June precipitation is favorable in Iowa for two reasons: i) rapid and unconstrained root growth (up to 1.3 inches per day); ii) given generally high soil water content in the early spring, additional precipitation will stimulate nitrogen loss.
In terms of grain yield equivalent, model analyses suggest that root access to shallow groundwater accounted for 1% to 46% of total grain yield. The contribution was lower in sites with sufficient rain and higher in sites with drought. In addition to water, the same analyses indicated that the subsoil had more than enough nutrients for sustaining high crop yields.
Cool temperatures in August and September reduced transpiration rates, slowed development, and extended the grain-filling period. Additionally, the growing season was extended by a later than normal first killing frost in the fall. This resulted in higher than normal seed weight in corn.
Together, these factors contributed to surprisingly high corn yields in 2017. Quantifying temperature, precipitation, and water table dynamics across the state has been an important component of moving the science of digital agriculture forward to enable better predictions of yield and will greatly assist management decisions and predictability of crop yields and nitrogen losses.

Figure 1: Cumulative difference between 2017 precipitation and 35-yr average for five locations in Iowa. SW = southwest, NE = Northeast, NW = Northwest, SE = Southeast. Grain yields ranged from 190 to 235 bu/ac.

Figure 2: Cumulative difference between 2017 cumulative GDD and 35-yr average for five locations in Iowa. SW = southwest, NE = Northeast, NW = Northwest, SE = Southeast. Grain yields ranged from 190 to 235 bu/ac.
You May Also Like
Enter a zip code to see the weather conditions for a different location.


