Subscribe to receive top agriculture news
Be informed daily with these free e-newsletters

Conservation tillage was used on about 70% of soybean acres in 2012; 65% of corn acres in 2016; 67% of wheat acres in 2017, and 40% of cotton acres in 2015.
September 27, 2018
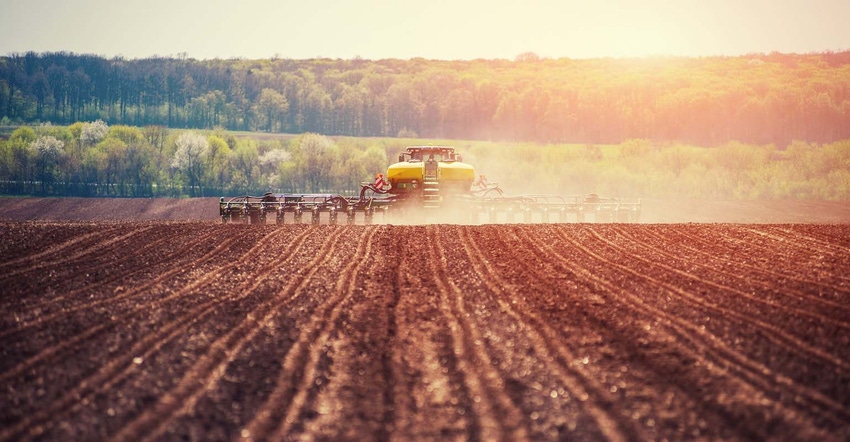
USDA’s Economic Research Service examined tillage in a new study, Tillage Intensity and Conservation Cropping in the United States.
USDA conservation programs are increasingly focusing on reducing tillage and promoting cropping practices designed to improve soil health. Progress toward improving soil health and soil erosion control can be monitored by tracking trends in the use of practices that reduce or minimize soil disturbance and increase soil cover.
What did the study find?
Conservation tillage practices vary widely across crops and regions of the country.
Conservation tillage was used on about 70% of soybean acres in 2012; 65% of corn acres in 2016; 67% of wheat acres in 2017, and 40% of cotton acres in 2015.
No-till grew rapidly in wheat acres from 2004 to 2009, with growth slowing from 2009 to 2017.
No-till adoption in soybean acres grew rapidly from 2002 to 2006, but declined from 2006 to 2012.
Almost 50% of corn, soybean, wheat and cotton acres were in no-till or strip-till at some time over a four-year period – including the survey and three previous years – but only about 20% of those acres were in no-till or strip-till all four years.
Conservation crop rotations are more frequently identified on land in the survey of corn producers than in soybean, wheat or cotton surveys.
Double cropping and cover crops were used on less than 5% of all surveyed fields.
Fallowing was used on less than 12% of wheat acreage and less than 5% of other crops.
Corn stover removal occurred on about 16% of corn acres.
Farms using no-till or strip-till are more likely to adopt practices that increase residue and cover.
Where did the data come from?
All data are from the Agricultural Resource Management Survey (ARMS), a national-level survey of farming operations conducted by USDA’s National Agricultural Statistics Service (NASS) and ERS. Data are based on the three most recent field-level, crop-specific production practice surveys of the four most widely grown U.S. crops: corn (2005, 2010, and 2016); soybeans (2002, 2006, and 2012); cotton (2003, 2007, and 2015); and wheat (2004, 2009, and 2017). Data on tillage operations, supplied by survey respondents, are used to identify fields in no-till (absence of tillage operations) and mulch till (tillage operations with a Soil Tillage Intensity Rating (STIR) less than 80). Using the STIR—rather than methods based on soil residue cover (previously
used by ERS to estimate conservation tillage adoption)—focuses our estimates on soil disturbance, rather than a combination of soil disturbance and residue from the previous crop. To capture the interaction of tillage and practices that increase soil cover, we estimate the extent to which conservation crop rotations, cover crops, double cropping, and fallow are used in conjunction with no-till. ARMS data provide a 4-year history of crops grown (including cover crops) and an indicator of no-till or strip-till for each crop in the history, as identified by the survey respondent.
Source: USDA ERS
You May Also Like
Enter a zip code to see the weather conditions for a different location.


