
Subscribe to receive top agriculture news
Be informed daily with these free e-newsletters
Suppose you could dial up the perfect season. What kind of summer would you select?
Here’s a chance to test your skills. Roger Glick, Glick Farms, Columbus, keeps accurate records on average yields and also on weather data day by day during the growing season.
His average yields for corn for 2014, 2015 and 2016, respectively, were: 191, 154 and 165 bushels per acre. Rainfall totals for the three years from April 1 until the first frost were 32.1, 40.9 and 45 inches, respectively. Total growing degree days accumulated from April 1 until the first killing frost for the three years were 3,536; 3,648 and 3,891, respectively. Growing degree days are a measure of heat units.

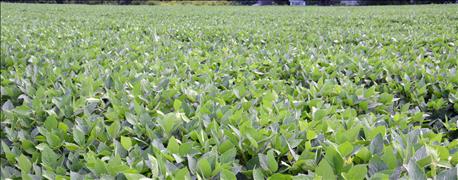
NEED RAIN AT RIGHT TIME: Soybeans looked good at midseason in many parts of Indiana. Many finished well, but in areas that received too much rain, saturated soils took their toll.
The number of days reaching 90 degrees F or higher from April 1 until the first frost in 2014, 2015 and 2016 were 12, 16 and 27, respectively. In 2014, July was the coolest month on record.
Explain corn trends
So what information in that weather data might explain why corn yield was highest in 2014? “Corn likes cool weather, especially during pollination and grain fill,” says Dave Nanda, a crops consultant based in Indianapolis. He doesn’t believe it’s an accident that the year with the fewest number of 90 degree days and cool weather in July produced the highest average yields.
That combination means less stress on the crop, Nanda says. Yet there were ample growing degree days during the season, and enough moisture at the right times.
In 2015, the season was too wet, Glick says. The heaviest rains started in late June and extended well into July. Much of their land is tiled, and tile helps, he notes. But tile alone can’t protect a crop from too much rain over a short period of time.
In 2016, the bigger rains came later. And there were considerably more 90 degree or higher days than normal. Rain makes grain, but it could make more grain if there were fewer hot days and less heat stress, Nanda says.
One factor that doesn’t show up directly in the weather data is disease pressure. However, lots of rain and warm weather in August and September led to disease in 2016 — especially diplodia ear rot and stalk rot, Nanda reports.
Soybean trends
Explaining soybean yield tends can be tougher, Nanda says. Soybeans need rain during August because that is the critical time for pod fill, he notes. However, even soybeans have their limit on how much rain they can handle.
In 2014, Glick recorded 4.8 inches of rain in July and 2.2 inches in August. In 2015, he recorded 10.1 inches in June, 6 inches in July and 2.1 inches in August. In 2016, he received more than 26 inches during July, August and September, with 11.4, 8.5 and 7.1 inches per month, respectively.
It was just too wet overall in his area at key times in 2016, Glick concludes. Soybeans were affected as well as corn.

You May Also Like
Enter a zip code to see the weather conditions for a different location.


