Here are complete results from our 31-year study of pre-harvest selling strategies. Files are presented for different locations around the Midwest, for both 2015 and the other years covered by the project. Results show performance on the basis of both per bushel and revenue per acre basis compared to results achieved just by selling at harvest with no forward pricing.
Three selling windows were examined: Early April, mid-May and late June. Averages for these three windows are also presented, along with average prices during two windows, from Jan. 1 to Sept 1, and from March 1 to Sept. 1.

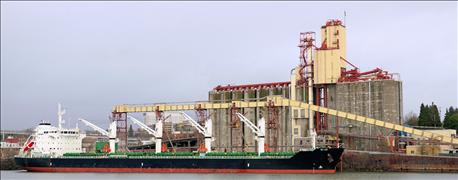
Updated stats offer a look at market price trends in key corn and soybean areas. (Photo: tfoxfoto/Thinkstock)
Some strategies combined the sale of futures or an HTA with the purchase of a call options to create a synthetic put. Results for these strategies assume the calls were bought on seasonal weakness in late February, late April and late May before the sales were made in early April, mid-May and late June. This shows the advantage or disadvantage to legging into the strategy, compared to just buying a put.
The study is based on futures and options settlements and cash prices during the 1985-2015 crop years. Revenues are weighted by statewide yields, taking into account gains and losses from yields being more or less than expected, assuming 100% of normal yields are sold on dates indicated. Harvest dates varied according to date 50% of crops are harvested in weekly crop progress reports, with estimates made for 2015 in some states due to the federal government shutdown. Brokerage commissions figured at 1 cent per bushel. Actual published cash prices and CBOT settlements are used, though no bushels were actually sold or trades executed, because all results are hypothetical. Settlement prices for some options were estimated where unavailable using the standard options pricing model.
Corn
1985-2015 Summary By Terminal
1985-2015 Summary By Year
2015 Summary By Terminal
Central Illinois
Central Indiana
Cincinnati
Denver
Evansville
Garden City, KS
Kansas City
Minneapolis
North Central Iowa
Omaha
Toledo
Soybeans
1985-2015 Summary By Terminal
2015 Summary By Terminal
1985-2015 Summary By Year
Central Illinois
Central Indiana
Cincinnati
Garden City, KS
Kansas City
Minneapolis
North Central Iowa
Omaha
Toledo
About the Author(s)
You May Also Like


