
Subscribe to receive top agriculture news
Be informed daily with these free e-newsletters
May 20, 2016
El Niño has diminished rapidly in strength during this spring. Past years with similar transitions have had dry conditions across Iowa with warm conditions in Northeast Iowa and average to cool conditions in Southwest Iowa. Historical conditions suggest early planting may be expected but slow plant growth may be expected across the state, except in Northeast Iowa. However, the opposite has happened.
While 2016 April conditions were dry as expected for much of Iowa, April temperature was much warmer than expected. The April rainfall was much above normal in Texas and across the Gulf Coast states indicating that the rainfall patterns could be explained by a slower northward transition of the jet stream during spring. Also, storms moved slower across the southern tier of the states, allowing more rain in the central United States. Slow moving storms also spread warmth across the central United States in April, resulting in unprecedented April temperature compared to past El Niño years. The impact on corn planting has been positive with early planting as expected but much better growth than in past El Niño years. Unfortunately, early May rainfall slowed soybean planting so that it was not much above the normal planting pace.
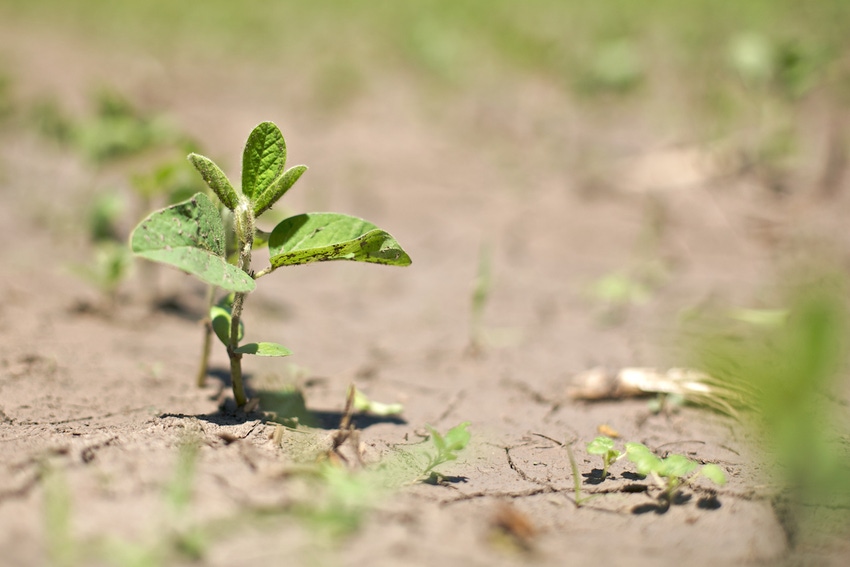
Soybean planting in Northwest Iowa is well behind the rest of the state and ISU field agronomist Joel DeJong reports “more wet areas and fields not planted than I had ever observed before here in NW Iowa”.[1] On top of this, the northern tier counties have had early May frost. This has occurred in only 2-4% of past El Niño years.[2]
El Niño and summer drought
The concern in 2016 is drought. Our best leading indicator for drought is La Niña (warm tropical Pacific water that displaces winter and spring rainfall in the United States). Drought occurs 60% of the time when La Niña is strong in July and August.
The transition from strong winter El Niño to strong summer La Niña is rare. The most recent occurrences are the transitions in winter 2009 to summer 2010 and winter 1997 to summer 1998. In both instances, drought conditions were isolated and short-lived. State-level soybean yield did not suffer though some counties did have yield well below the historical trend.
Seasonal forecasts provide a mixed guidance on the possibility of summer drought. At present, national forecasters have predicted 65% chance of La Niña in July-August-September. The drought probability can be estimated as the product of probability for La Niña and probability of drought when La Niña occurs: 65% * 60% = 39%.
Abnormally warm summer conditions are more likely than drought. A pattern of abnormally warm weather has been in place since last winter. While early May has been cool, this is expected to be a brief stretch of cool weather. Because sub-soil moisture is rated as adequate or surplus for 84% and 15% of the state[3], respectively, yield is expected to be protected from abnormally warm summer given the low chance for extended and widespread summer drought.
Northwest Iowa is off to a rough start with excessive wetness that has it on a trajectory for below trend yield. Across the state, however, the transition from El Niño to La Niña should not be expected to adversely affect soybean yield. Since 1950, seven years have transitioned from strong winter El Niño to summer La Niña. On average, state-level soybean yield compared to the average yield of the previous five years is substantially higher: 107% (Table 1). Using 2011 – 2015 as the 5-year basis, the projected state-level yield is 53 bu ac-1. To account for excessive soil moisture and delayed planting in Northwest Iowa, the low end of the range can be used, 102%, producing a projected state-level yield of 50 bu ac-1.
Table 1. Soybean yield in years with El Niño transition to La Niña expressed at percent of average soybean yield of previous five years.
Year | 1958 | 1966 | 1970 | 1973 | 1992 | 1998 | 2010 | Composite |
Yield | 110% | 105% | 104% | 102% | 116% | 105% | 103% | 107% |
The range in yield from the effects of favorable weather can be larger than trend. Using USDA NASS data for 1987 – 2015 (when NASS began surveys of pod count), the soybean yield trend is 0.45 bu ac-1 increase per year. Over the five-year period 2011–2015 that trend line estimate translates to 3.7% yield increase. This means the average yield increase of 7% over the 5-yr average that has occurred during an El Niño transition has outpaced the 5-year yield trend line. In only 1 of 7 previous El Niño transitions, the state-level soybean yield increase has failed to outpace the 5-yr trend line. Of course, soybean yield in Iowa had been flat until 2015. In upcoming articles, I will address the extent to which weather variability is to blame for the flat yield trend during 2005 – 2014.
Originally published by Iowa Soybean Association On-Farm Network.
[1] http://crops.extension.iastate.edu/blog/jody-l-korthaus/field-update-corn-planting-nears-completion-wet-conditions-delay-progress-some
[2] http://www.cropclimate.org
[3] Iowa Crops and Weather Report, 2016 May 9
You May Also Like
Enter a zip code to see the weather conditions for a different location.


