June 13, 2018

Source: University of Wisconsin-Madison
U.S. soybean [Glycine max (L.) Merr.] production has increased by 60% from 1996 to 2016 due to a 30% increase in area planted to soybean, and due to better genetics and improved crop management practices. While these historic seed yield increases have been substantial, U.S. soybean producers continually search for opportunities to optimize crop management and increase soybean seed yield, including applying fertilizer N to soybean.
Soybean has a large nutrient requirement throughout the growing season, and has an especially high N requirement due to its seed protein content that averages about 40% based on seed dry weight (Bellaloui et al., 2015). Soybean N requirements peak in the R3 to R6 growth stages (Gaspar et al. 2017; Harper, 1974). The N requirement of soybean is generally fulfilled by biological nitrogen fixation (BNF) plus N uptake from soil (Salvagiotti et al., 2008). However, BNF activity can be limited by a number of environmental conditions such as low soil moisture, extremes of soil pH and temperature, and soil compaction, any of which can result in insufficient N supply to the soybean plants (Purcell and King, 1996).
Extensive research to date has documented the impacts of N fertilizer source, application rate, application method, and seasonal timing on U.S. soybean yield. Many of these studies show inconsistent response of soybean yield to N application within and across states which may have been due to differences in soybean cultivars, soil properties, climatic conditions during the growing season, topography, and crop management practices (Osborne and Riedell, 2006). Because a single study was not conducted at multiple U.S. locations for several years, we combined data from multiple soybean N fertilization studies across multiple locations and years. Thus, the objectives of this study were to examine the effects of N fertilizer in terms of N-application number (single or split applied), N-method (soil surface, soil incorporated, foliar, or a combination of these), N-timing (pre-plant, at-planting, Vn or Rn growth stages, or combination of these), and N-rate on soybean seed yield across the U.S.
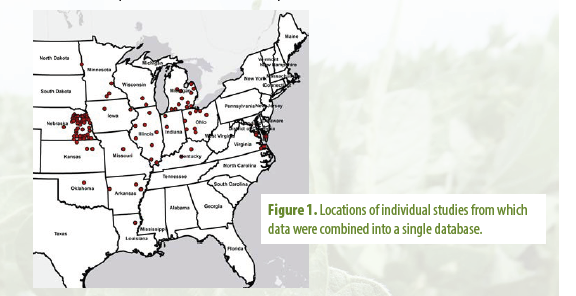
Locations of individual studies from which data were combined into a single database.
Materials and methods
Soybean yield data were aggregated from replicated field experiments established from 1996 to 2016, at 105 locations within 16 states across the U.S. (Fig. 1). The resultant database consisted of 5991 plot-specific yield data derived from a total of 207 environments (experiment × year). All individual trials were replicated within their respective environments.
For every experiment, the data were coded for the four N-related variables and for five major management variables (hereafter called “MM”.) The N variables were:
(A) N-applications (i.e., zero N control, one, or two applications),
(B) N-method (i.e., zero N control, applied to the soil surface, soil-incorporated, foliar-applied, or a combination of these methods),
(C) N-timing [i.e., zero N control, pre-plant applied (pP), applied at planting (P), or at a vegetative stage (Vn), or at a reproductive stage (Rn), or split-applied at planting then at an Rn stage (PR), or split applied at two Rn stages (RR)], and
(D) N-rate (0-505 lb/ac).
The MM variables considered in our analysis were: irrigation (irrigated or rainfed), tillage (conventional or reduced tillage), previous crop (cereal or legume), seeding rate (range of 123,000 to 256,000 seeds/ac), and crop row width (range of 7 to 40 inches).
Among all experiments, most plots received a single N application, though ca. 13% of total plots did receive a split N application. Nitrogen application on the soil surface was the most common method, whereas foliar, soil incorporated, and other combinations were used less frequently. Similarly, a single N application during an Rn stage was the most common timing, with pre-planting (pP) and split N applications (PR, RR) used less frequently. The mean and median N rates were 67 and 40 lb/ac, respectively. These results show that across all experiments, the most common N treatment involved a single, surface-applied N application during reproductive growth.
Multilevel modeling was used to quantify N and non-N related sources of the observed soybean yield variability. To test the average effect of N-rate across all experiments, the linear and quadratic forms of N-rate were included in the model. Additionally, conditional inference regression trees methodology was used to identify the effects of MM decisions and N variable interactions on soybean yield across the examined region.
Results and discussion
Among all experiments, only a small fraction (<1%) of total variability was attributed to each N variable within experiment × year. This result shows the small N-related effect on soybean yield relative to other sources of variability (e.g., weather, soil, and MM decisions). The among-experiment average effect of N-application on soybean yield was significant (Fig. 2 A). A single N application was 0.9 bu/ac greater yielding than the control, and the split N application also resulted in 1.6 bu/ac greater seed yield than zero N plots, as did the split N application with more than one application method, which yielded 1.8 bu/ac more than non-treated plots (Fig. 2 B). Split application of N with more than one application method (e.g., surface and foliar) resulted in the greatest average soybean seed yield (63.4 bu/ac), but not significantly more compared to when N was surface- or foliar-applied (Fig. 2 B). Nevertheless, the yields attained with the combined N-methods of application were significantly greater than the yields generated from non-treated plots and soil-incorporated N, respectively.
Small differences were observed among different N application timings (Fig. 2 C). The greatest average yield was observed for PR, which was significantly greater than control and a single N application during Rn. Nevertheless, the 0.9 to 2.7 bu/ac yield differences from the other N application timings were not statistically different.
Soybean yield response to N-rate was quite variable at the lower N rates (up to ca. 1.9 bu/ac), for which there were many experimental data points (Fig. 2 D), but when coupled with the fewer data points at the higher N rates, the use of all experimental data generated a second-degree N polynomial function that was significant (p=0.0297), and it projected the N rate of 300 lb/ac for maximization of soybean yield. The large yield differences among individual experiments where a similar N rate was applied was attributed to in-season weather variability among the diverse growing environments (e.g., north vs. south), and to MM practice differences. These results suggest that other, non-N practices might affect soybean yield alone, or in interaction with N decisions.
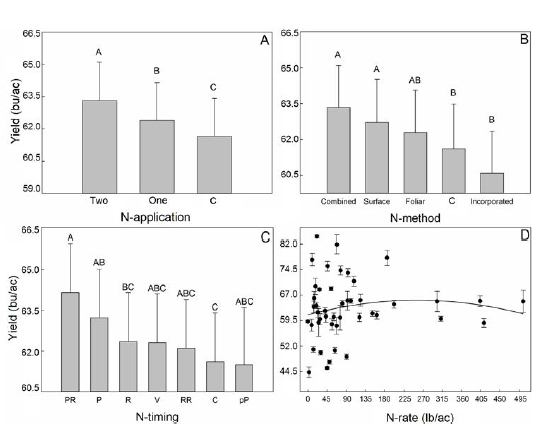
Mean effect of individual N variables on soybean seed yield, when averaged over all experiments, for A) N-applications, B) N-method, C) N-timing, and D) N-rate (lb/ac). Note: C - no N control, One - single N Application, Two - split N applications, C - No N control, Combined - soil surface- and foliar-applied, Surface - soil surface-applied, Foliar - foliar-applied, Incorporated - soil incorporated, PR - split applied between planting and a reproductive (Rn) stage, P - applied at planting, R - applied at a Rn stage, V - applied at a vegetative (Vn) stage, RR - split applied between two Rn stages, pP - pre-plant applied. Vertical lines represent standard errors of the mean. Yields with the same letter were not significantly different at alpha=0.05.
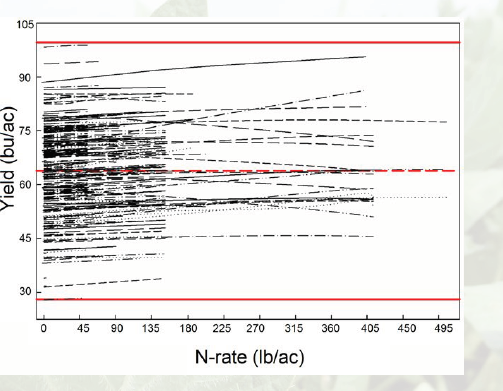
Environment-specific effect of N-rate (lb/ac) on soybean seed yield in 207 environments (experiment × year combinations). Note: Bottom and upper solid red reference lines delineate the bottom and upper specification and the middle dashed red reference line denotes the average.
Nevertheless, in most individual environments, the effect of a greater N-rate on soybean yield was not significant (Fig. 3). From the 207 environments included in the analysis, only 13 of the N slopes were significant (p<0.05) with an estimated yield increase of 0.14 to 0.5 bu/ac for every 10 lb of applied N. These environments included irrigated experiments in Arkansas and rainfed experiments in Illinois, North Dakota, and Ohio. Among these environments, yield ranged from 50.6 to 86 bu/ac. This result implies that despite the yield differences among environments, soybean response to N was minimal across the examined regions.
To identify and quantify the management variables that influenced soybean yield across all experiments, the fitted conditional inference tree included four MM variables (irrigation, seeding rate, tillage, and row width) and two N variables (N-timing and N-rate) (Fig. 4). The results of the model suggest that in irrigated experiments, a single N application during a Rn stage, or split N applications during Vn and Rn stages, or during two Rn stages resulted in 3 bu/ac greater yield than the rest of the N timings. However, in rainfed experiments, the addition of supplemental N was significant only when seeding rates were >175,000 seeds/ ac. From the total 5991 N-treated soybean yields, 36% were associated with such high seeding rates. In these experiments, N rate >13.5 lb/ac (and up to 505 lb/ac) at P, PR, RR, and V growth stages resulted in 3-6 bu/ac greater yield when compared to the other N timings and rates. These results indicate that non-N practices interact with N decisions and thereby affect soybean yield response to N application.
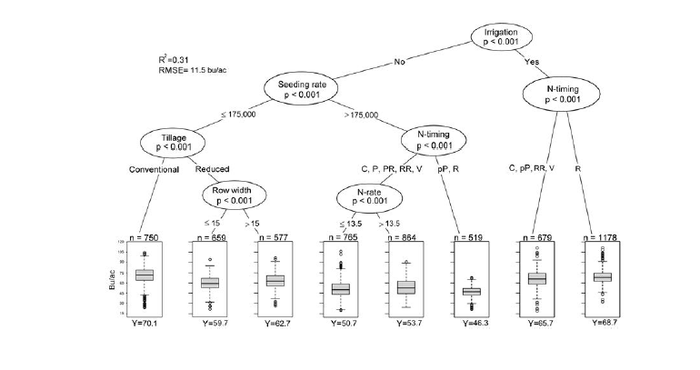
Conditional inference tree across the examined region. In each boxplot, the central rectangle spans the first quartile to the third yield quartile. The solid line inside the rectangle is the mean, whose numerical value is shown at the boxplot bottom (Y). The vertical lines above and below the rectangle denote the maximum and minimum, respectively. White circles represent outlier yields. Note: n=number of plots, Y=average soybean yield within a terminal node (bu/ac), C -No N applied, P - applied at planting, PR - split-applied between planting and a reproductive (Rn) stage, RR - split-applied between two Rn stages, V - applied at a vegetative (Vn) stage, pP - pre-plant applied, R - applied at a Rn stage. Seed rate (1000 seeds /ac), Row width (inches) and N-rate (lb/ac).
Conclusions
The analysis revealed that N management decisions had a measurable, but small, effect on soybean yield. Overall, the limited responses to N effects in our study, as well as the costs associated with N application, indicate that these small positive effects would be unlikely to result in positive economic returns from N fertilization decisions. The research findings we present here suggest that N management can only be optimized when considering the cropping system because non-N management practices such as irrigation and seeding rates interacted with N-timing and N-rate.
References
Bellaloui, N., Bruns, H.A., Abbas, H.K., Mengistu, A., Fisher, D.K., & Reddy, K.N. (2015). Effects of row-type, row-spacing, seeding rate, soil-type, and cultivar differences on soybean seed nutrition under us Mississippi Delta conditions. PloS one, 10, e0129913.
Gaspar, A., Laboski, C., Naeve, S., & Conley, S. (2017). Dry matter and nitrogen uptake, partitioning, and removal across a wide range of soybean seed yield levels. Crop Science, 57:1-13 doi: 10.2135/cropsci2016.05.0322.
Harper, J. (1974). Soil and symbiotic nitrogen requirements for optimum soybean production. Crop Science, 14:255-260.
Originally posted by the University of Wisconsin-Madison.
You May Also Like


