May 4, 2017

(In this three-part series, Syngenta global head of soybean breeding Joseph Byrum shares the results of a big data analysis of more than 400 research experiments on plant populations and soybean yields, published in scientific journals. The goal was to find the optimum plant density given different planting dates and varietal maturities, so growers can increase their probability of success and profit). Check out parts one and three here.
As we discussed in Part I, the way to maximize soybean output at the lowest cost is to ensure the plant canopy has enough leaf area to absorb 95 percent of the solar radiation from the pod formation stage forward. This can either be achieved with a large number of small plants, or a smaller number of large plants. While both approaches are equally effective from a yield perspective, input costs are significantly reduced if the farmer strives for the optimal number of large soybean plants.
But how does one know how many plants are enough? There’s no one answer to that question. For a given field, the optimal plant population is a moving target that varies according to numerous environmental, genetic and management factors.
Scientific data guides the way
Through our big data analysis of over 400 trials in North and South America, we evaluated which factors have the most impact on the relationship between plant population and yield.
A statistical analysis of the research data found that maximum yield was achieved, on average, at a density of 104,000 plants per acre. Of course, this is only useful as a rule of thumb. It serves as a useful starting point to optimize plant population.
With more data about a farmer’s individual situation, it’s possible to zero in on the minimum number of plants needed to achieve maximum yield.
Location, location, location
As with real estate, science shows that location is everything when it comes to plant performance. The soil condition, the length of the growing season and similar factors that vary greatly with where a field is located has the greatest impact on the optimal plant population.
Within the United States, soybean is typically planted in 18 states that can be divvied up by region — the Mid-South stretching from Texas to Kentucky; the Eastern Corn Belt of Wisconsin, Illinois, Indiana, Michigan and Ohio; the Western Corn Belt of North Dakota down to Kansas and Minnesota to Missouri; and the Southeast where only North Carolina makes the USDA’s top-18 ranking.[1] Other results come from parts of Canada, and for South America, they come from Argentina and Brazil.
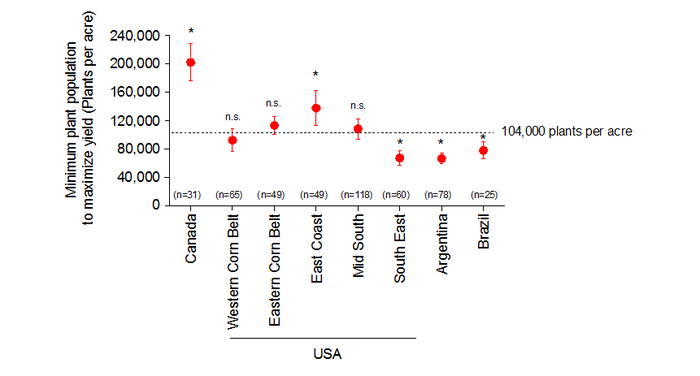
The data suggest the northernmost locations, such as those in Manitoba, required the greatest population density of about 200,000 plants per acre to achieve maximum yield. In South America, by contrast, 70,000 to 80,000 plants per acre were needed. The Eastern Corn Belt came in right about the average of 100,000 plants.

Figure 1. Minimum plant population required to maximize yield across the evaluated regions. The overall recommendation after the analysis of ~400 trials is 104,000 plants per acre. The (*) indicates that there is statistical evidence that the minimum plant population for a particular region is different compared to the overall recommendation. The (n.s.) indicates there is no statistical evidence that the minimum plant population for a particular region is different compared to the overall recommendation. n.s. stands for not significant. The number between parentheses indicates the number of trials assessed in that particular region. [1] http://usda.mannlib.cornell.edu/usda/current/CropProg/CropProg-04-24-2017.pdf
Making sense of the biology
That’s a huge spread in the minimum number of plants needed to achieve maximum yield, but it makes sense when one considers the biological factors underlying these regional differences. Since yield depends on having enough leaf area to absorb solar radiation, it makes sense that temperate and tropical locations can get by with less dense fields. All else being equal, temperate regions have the advantage of a longer vegetative period. With more time to grow a fuller canopy, plants in the sunnier climates of the American South are fuller and can collect more solar energy, growing large enough that maximum yield is realized at a density as low as 70,000 plants per acre.
The reverse is true in the colder climates of the north. With less time available for growth, the leaf area will be smaller. To absorb as much light is possible, farmers will need to plant more seeds to keep leaf area —and thus, yields — as high as they can possibly be. This might be as many as 200,000 plants per acre in Canada.
The importance of timing
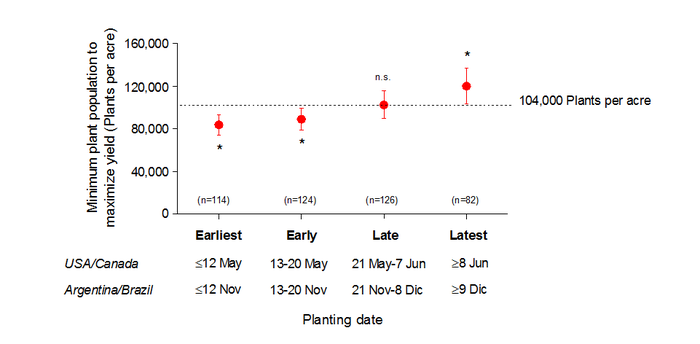
Planting date is the next, most significant factor to consider when determining the optimal plant density for a given field. If plants are allowed a longer vegetative period, they will have fuller growth that allows more sunlight to be captured. So, all other factors being equal, growers should plant as early in the season as they can without subjecting the plants to the danger of freezing. On average, planting before May 12 brings the average plant population needed for maximum results down from 104,000 to 85,000. Waiting beyond June 8 pushes the minimum needed to 122,000 plants per acre.

Figure 2. Minimum plant population required to maximize yield across planting dates. The overall recommendation after the analysis of +400 trials is 104,000 plants per acre. The (*) indicates that there is statistical evidence that the minimum plant population for a particular planting date is different compared to the overall recommendation. The (n.s.) indicates there is no statistical evidence that the minimum plant population for a particular planting date is different compared to the overall recommendation. n.s. stands for not significant. The number between parentheses indicates the number of trials assessed for each particular planting date. |
Soybean farmers know the seed variety group best able to reach maturity before the weather turns frosty. Shorter maturity groups grow faster, which means their vegetative period is shortened and the plants wind up smaller than those in the longer maturity groups, with less leaf area to capture sunlight. To make up for this deficit, a denser planting arrangement will be needed.
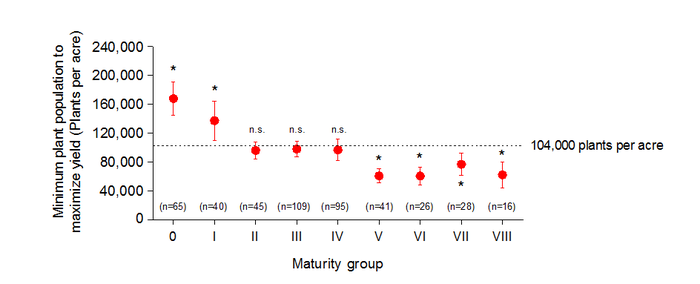
That’s why maturity group 0 will require 170,000 plants per acre, on average, to achieve maximum yield while, on the other end of the scale, maturity groups V through VIII only need 65,000 to achieve the same result. In between, maturity group I needed a density of 140,000, and maturity groups II through IV are right at the rule of thumb, needing about 100,000 plants to reach the best results in yield.

Figure 3. Minimum plant population required to maximize yield across maturity groups. The overall recommendation after the analysis of +400 trials is 104,000 plants per acre. The (*) indicates that there is statistical evidence that the minimum plant population for a particular maturity group is different compared to the overall recommendation. The (n.s.) indicates there is no statistical evidence that the minimum plant population for a particular maturity group is different compared to the overall recommendation. n.s. stands for not significant. The number between parentheses indicates the number of trials assessed for each particular maturity group. |
These three factors — location, timing and maturity group — have the greatest impact. Scientific research considers each in isolation so that we can better understand what’s going on from a biological perspective. But crop fields aren’t isolated, and all these factors interact with one another. So in Part III of this series, we’ll take a practical look at how farmers can zero in on the optimal plant population by evaluating these factors in combination with one another.

Greg Doonan, Joe Byrum, Tracy Doubler, and Chris Zinselmeier, headshots, portraits, syngenta
Joseph Byrum is Senior R&D and Strategic Marketing Executive in Life Sciences – Global Product Development, Innovation and Delivery at Syngenta. He writes about agricultural innovation. Connect on Twitter @ByrumJosephTo read the first part of the series, check it out here or part three of the series here.
About the Author(s)
You May Also Like


