January 30, 2018

Think Different.
In the past, identifying causes of the soybean yield gap—the difference between producer yields and maximum yield potential—has been limited to information gathered from single farms or small geographic areas. That changed when a novel approach recently sought out reasons for the gap by combining big data from producers across the north-central United States, with diverse climate, soils, and rainfall data from 10 states.
It’s one thing to learn the management techniques that have brought a single farmer or small group of farmers closer to realizing potential soybean yields, but when management information is gleaned from top yields from several thousand producers across ten states, the power of big data produces matches to measured productivity you might want to take to heart.
In a presentation at the recent Iowa State University Integrated Crop Management Conference, Shawn Conley outlined the key management practices that explain soybean yield gaps across the north-central United States. The Soybean and Small Grains Specialist at the University of Wisconsin also offered up management techniques that produced higher yields across the board, based on producer-provided data from 3,568 fields planted to soybeans in 2014 and 2015.
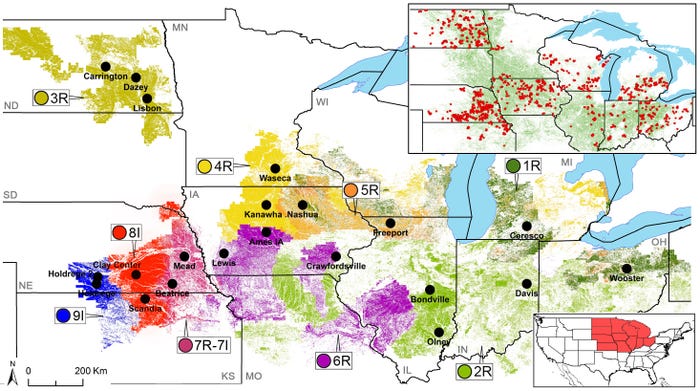
“A major challenge with this kind of data is how to cluster producer fields to identify management factors that consistently lead to higher yields for a given climate and soil combination,” Conley said. “In this analysis, surveyed fields were grouped based on their climate and soil using the spatial framework of the Global Yield Gap Atlas. It delineates regions based on annual growing degree days, an aridity index, annual temperature seasonality, and plant-available water holding capacity in the rootable soil depth. You could get more information from my co-investigator, Patricio Grassini at the University of Nebraska, and two of the graduate students who did much of the work, Juan I. Rattalino Edreira at Nebraska and Spyridon Mourtzinis here at the University of Wisconsin.” The regions are called TEDs—technology extrapolation domains.

The yield gap study gathered data from producer fields across 10 states in the North Central U.S. Surveyed fields were grouped based on their climate and soil using the spatial framework of the Global Yield Gap Atlas. It delineates regions, called TEDs, based on annual growing degree days, an aridity index, annual temperature seasonality, and plant-available water holding capacity in the rootable soil depth. Six TEDs designated “R” were rainfed, two TEDs designated “I” were irrigated fields, and in one TED (7) both rainfed and irrigated fields were analyzed.
Early planting biggest yield driver
The analysis estimated annual yield potential using measured weather data, including solar radiation, rainfall, and maximum and minimum air temperatures, collected at meteorological stations located near the surveyed fields. The yield gap was calculated as the difference between the potential yield and average producer yield.
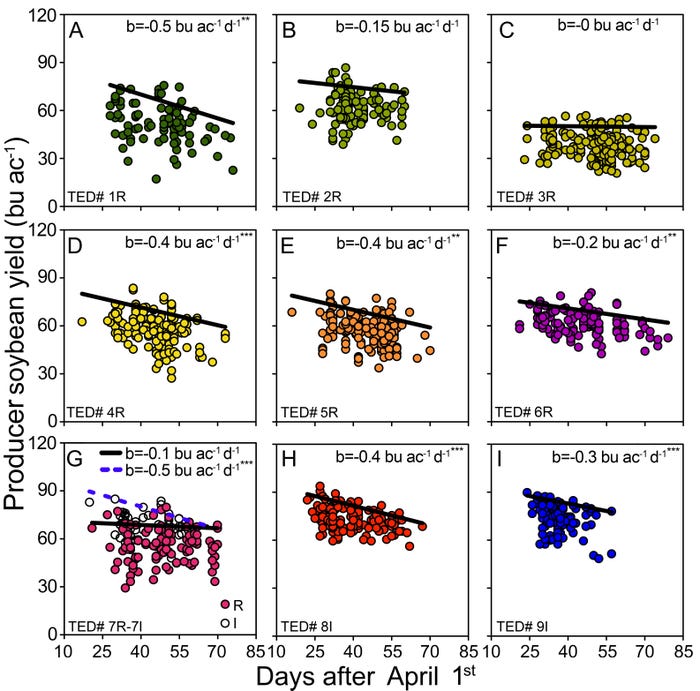
Planting date had the most consistent impact on narrowing the gap for potential soybean yields—high yielding fields were planted, on average, 7 days earlier than low yielding fields in both irrigated and rainfed conditions. The yield penalty for late planting across the TEDs ranged from 0 to -0.5 bu/ac/day.
Planting dates were not found to be as important when moisture was limited over the season. However, limited water availability at pod setting (R3–R5) phase produced more yield drag than limited water at early vegetative, vegetative, and seed filling phases, because of later planting dates.
“This study confirms the notion that nothing makes up for early soybean planting,” Conley said. “But don’t mud them in.”
In more than half the TEDs, analysis found that tilled fields (including chisel, disk, strip-till, ridge-till, vertical, field cultivator and moldboard plow) out yielded no-till fields by 2.3 bu./acre. “But there may be other functional reasons besides yields to use no-till,” Conley said. “No-till can help control soil erosion and reduce irrigation requirements, as we found that in half the TEDs total irrigation was 2.5 inches less in no-till versus tilled fields, on average.”
Fungicides, insecticides and tile drainage bump yields
“There was an overall statistically positive impact of foliar fungicide and/or insecticide of 4.6 bushels an acre, but the magnitude of these yield differences was not consistent across TEDs and not even significant in some of them,” Conley said. “For example, average yield of fields treated with foliar fungicide and/or insecticide was 11.2 bushels an acre higher than untreated fields in TED 7R, but the yield difference was negligible and not statistically significant in TED 6R region.”
“While the numbers aren’t consistent across all TEDs, I think this information tells us we shouldn’t cut corners on seed treatment. And with the yield penalties for late planting, if we have a thin stand and are considering replanting, we might well be better off investing in herbicides, not more soybean plants.”
Conley said the analysis also showed tile drained fields produced a 2.7 bushels/acre increase overall, but achieved statistically higher yields compared to fields without artificial drainage in only two of six TEDs.
Mixed bag with other practices
There was much less consistency, and only small differences, in yield response from row spacing, seeding rate, seed treatment, nutrient (N, P, K) application, lime, and manure.
“We need to interpret this lack of yield differences with caution, though,” Conley said. “Some of these practices might influence yield depending on the level of another practice. Or the benefits of the practice might only be realized in a season of unfavorable weather.”
Irrigated fields included in comparisons
Because the impact of management factors on yield is influenced by water supply, irrigated fields were included in the survey and were separated for analysis. Six TEDs included only rainfed soybean fields while two TEDs included only irrigated soybean fields. One TED included both irrigated and rainfed soybean fields. The result was a total of 10 TED and water regime combinations that were eventually used for analysis and benchmarking.
Research-selected TEDs included 38% of the surveyed fields (total of 1,343 fields) and accounted for 25% and 45% of US rainfed and irrigated soybean area, respectively. Each individual TED contained ≥98 (rainfed) and ≥59 (irrigated) surveyed fields, with an average of 137 fields per TED.
Closing the yield gap
Soybean producers seem to be closing the gap between potential and realized yields, particularly on irrigated fields. Average estimated yield potential in rainfed TEDs ranged from 48 to 80 bu/ac, while average estimated potential yields in irrigated fields varied from 80 to 91 bu/ac across TEDs. Up scaled to the entire North Central US region, the rainfed and irrigated yields were projected to a potential average of 71 and 85 bu/ac, respectively.

Soybean yields plotted against planting date in the 10 regions showed wide variability in the penalty for late planting, but consistently showed yields dropped as planting dates progressed after April 25. Yields were less affected in irrigated fields in TED 7I, indicating limited water availability in rainfed fields at pod setting (R3–R5) phase because of later planting dates produced more yield drag than limited water at early vegetative, vegetative, and seed filling phases.
Average producer yield was consistently lower than potential yields on both rainfed and irrigated fields across all TEDs. There was a large variation in average annual yield across TEDs, ranging from 39 to 73 bushels/acre. The yield gap tended to be larger in rainfed (range: 15–28%) than in irrigated (range: 11–16%) TEDs. At the regional level, the rainfed yield gap averaged 22% in contrast to the irrigated yield gap of 13%.
This study was funded by the North Central Soybean Research Program and the Wisconsin and Nebraska Soybean Marketing Boards. Agronomists and plant scientists from universities in Nebraska, Kansas, North Dakota, Minnesota, Iowa, Illinois, Wisconsin, Ohio, and Michigan and the Iowa Soybean Association helped with the study.
About the Author(s)
You May Also Like


