August 8, 2018

Financial risk is incurred when a farm borrows money to purchase assets or operate the farm and is caused by uncertainty pertaining to interest rates, lending relationships, changes in market value of assets used as collateral and cash flow used to repay debt. Leverage is measured using a farm’s debt-to-asset ratio. It’s directly related to financial risk and it impacts farm growth.
Leverage influences a farm’s growth rate through its effect on expected returns and risk. The impact of financial leverage on a farm’s return on equity and sustainable growth rate depends on the relationship between return on assets and the interest rate on borrowed funds. If a farm’s return on assets is larger than the interest rate on borrowed funds, financial leverage will increase the return on equity and the sustainable growth rate.
However, higher financial leverage leads to an increase in financial risk. Specifically, as financial leverage increases, the potential loss of equity increases, the variation in expected returns to equity increases and liquidity provided by credit reserves lessens. Credit reserves are defined as the difference between a farm’s operating line limit and the amount of operating funds borrowed.
Owner withdrawals for items such as family living also have an impact on expected returns and risk. As the owner withdrawal rate increases, expected returns decrease and financial risk increases.
Leverage examples
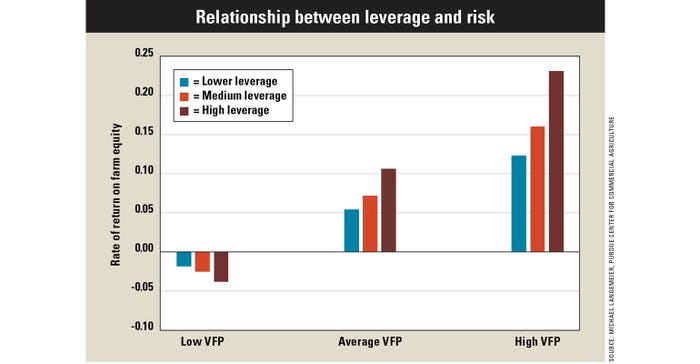
The graph illustrates the impact of leverage on the rate of return on farm equity, which is directly related to a farm’s growth rate, for three “value of farm production,” or VFP, scenarios. The average VFP scenario represents average profitability and financial efficiency for this case farm. The low VFP scenario assumes that revenue is 20% lower than average, while the high VFP scenario assumes that revenue is 20% higher than average.

Costs were assumed to be the same for each VFP scenario. Retained earnings were computed by subtracting family living expenditures from net farm income. The resulting retained earnings for each VFP scenario were then added to ending total assets, which was used to compute average total assets.
Three leverage levels are illustrated: low leverage, or a zero debt-to-asset ratio; medium leverage, or a 25% debt-to-asset ratio; and high leverage, or a 50% debt-to-asset ratio. Interest paid and average total liabilities vary among leverage levels.
As shown in the graph, the rate of return on equity for the high leverage level is considerably more variable than the rate for the low and average leverage levels. The rate of return varies from -0.0189 to 0.1232 for the low leverage level, from -0.0253 to 0.1609 for the average leverage level, and from -0.0382 to 0.2320 for the high leverage level.
For the average and high VFP scenarios, rates of return and farm growth increased with leverage. Conversely, for the low VFP scenario, rates of return and farm growth decreased with leverage.
Langemeier is a Purdue University Extension agricultural economist and associate director of the Center for Commercial Agriculture.
About the Author(s)
You May Also Like


