Subscribe to receive top agriculture news
Be informed daily with these free e-newsletters

Media release: Initial satellite-based winter wheat Forecast on March 23 to be followed by corn and soybeans on June 1.
March 29, 2017
Editor’s Note: This company media release is unedited, for your information.
Planalytics, Inc. has released its 2017 GreenReport Crop Yield Forecast publication schedule for winter wheat, corn, soybeans and five other summer crops. This is the sixteenth year that Planalytics has produced bi-weekly, in-season estimates of crop conditions and yield potential that are based on satellite-derived plant biomass data.
"With commodity prices remaining at some of their lowest levels in years, 2017 is shaping up to be another year of tremendous uncertainty for grain producers, buyers and crop insurers. On top of that, speculation about the effects of a possible recurrence of an El Niño event on crop yields sometime this summer is cause for further concern,² stated Jed Lafferty, Managing Director, Planalytics Life Sciences.
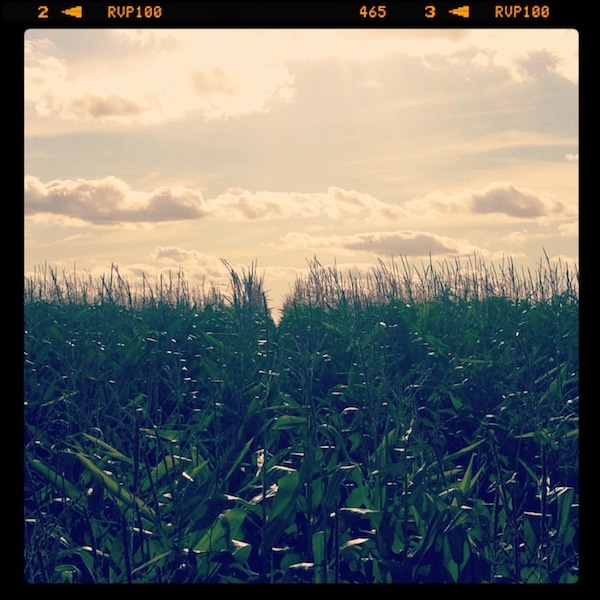
Since the late nineties, Planalytics and their strategic partners at TerraMetrics Agriculture, Inc. have used satellite imagery to regularly monitor and measure vegetative conditions across the U.S. The satellite ³Greenness² images provide a continuous, consistent measurement and allow for comparison against historic levels of NDVI, an estimate of the amount of chlorophyll that growing plants are producing at a given point in time.
"By using satellite imagery to evaluate crop conditions instead of traditional crop sampling techniques, our crop yield forecasts can be generated up to two months before USDA¹s official estimates," adds Dr. Jude Kastens, Research Assistant Professor at the University of Kansas Applied Remote Sensing Program (KARS) and senior analyst on the project. "Because these estimates are based on 1- km resolution Greenness data that are being acquired by satellite on a daily basis, we can use nearly cloud-free composite images to regularly update these yield forecasts every two weeks throughout the growing season and provide insights into the effects of weather and other factors that affect production."
According to Lafferty, the Planalytics/TMAI NDVI data set contains 28 years of imagery and corresponding annual yield history down to the county level. Their yield estimates are based primarily on predictive statistical models, bolstered by weather analytics and interpretation capabilities that represent key competencies of the Planalytics business weather intelligence organization. ³A typical growing season can see a roller coaster of weather conditions affecting crops within a particular region of the country, even down to the county and field level. Greenness data give us something that we can use in-season to assess the impact weather may be having on our clients¹ bottom lines while they still have time to do something about it.²
Entering the 2017 season, Planalytics Greenness images already show that the winter wheat crop is emerging from dormancy earlier than normal due to unusually warm conditions and other factors. "Our March 23rd winter wheat forecast will give us a better indication of crop potential than last year¹s final yield or even trend yields can," adds Kastens.
Planalytics GreenReport and Crop Yield Forecasts are available by subscription only. For more information, go to www.planalytics.com/agribusiness or contact Planalytics at 800.882.5881, extension 245.
You May Also Like
Enter a zip code to see the weather conditions for a different location.


