Subscribe to receive top agriculture news
Be informed daily with these free e-newsletters

When evaluating farm research, look closely at the results before jumping to any conclusions. This underscores the importance of not making major production changes based upon limited data.
October 13, 2015
As young children, we were taught in school that 1 + 1 = 2. In the world of interpreting agricultural research that equation might not always be true.
At this time of year, people like me frantically gather all their data and interpret the results. Over the next few months, growers will be bombarded with charts, graphs, tables, pictures and claims of greatness.
As an Extension scientist, it is one of my jobs to provide growers with reliable, research-based information. This is accomplished by conducting numerous field trials every year or by interpreting information developed by my colleagues. Studies are conducted using accepted scientific practices, replications over time and space, and statistical analyses. Recommendations are made only after multiple years or locations of a specific study are conducted. As an employee of a major land-grant university, I have no bias and can call it as I see it.
One of the things that has troubled me over the years is how data can often be misinterpreted or presented in a skewed way.
For example, take a look at the two separate graphs in this article. Both graphs present the very same data. The graph on the left looks completely different from the one on the right only because of the scale of the y-axis. Consequently, that might lead you to believe that there were major differences between these treatments. (I’ll get to that later.)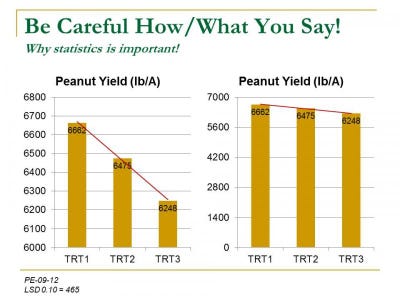
Someone might look at the graphs and say that TRT1 produced 414 lb/A more peanuts than TRT3 and 187 lb/A more than TRT2. Thus, TRT1 must be better than TRT2 or TRT3. Who wouldn’t want 187 to 414 lb more yield!
This is why statistics is so important in in the world of agricultural research and why 1+1 does not always equal 2. The yield data presented in these graphs was collected from a peanut trial I conducted a few years ago. After proper analysis, the three treatments on these graphs were not considered to be statistically different. Thus, the numerical yield differences that occurred in this test were totally random. What makes this even more interesting is the fact that all three treatments were nontreated controls. Nothing was done to these plots!!!! This further illustrates how different results can be just because where the data was collected in a particular field.
Now I don’t want to mire you in math and statistics but I hope that I have proven a point. When evaluating data results, it is important to look closely at the results before jumping to any conclusions. Also, this underscores the importance of not making major production changes based upon limited data.
So as we head into the 2016 winter meeting season, I encourage you to take a judicious look at all the information that will be presented to you. Be cautious of nonreplicated data or data that has not been properly analyzed. Numerical differences are not always real differences. In my 27 years of professional experience, silver bullets have been rare! As always, good weed hunting!
You May Also Like
Enter a zip code to see the weather conditions for a different location.


