Subscribe to receive top agriculture news
Be informed daily with these free e-newsletters
Any trading disclosure you read will likely include the phrase, “Past performance is not indicative of future results.” Just because it happened before does not mean it will happen again.
But, what if this year’s market was tracking a previous year’s price action so closely it would be hard to ignore? This may be a bit spooky, but it’s too good not to share.
Corn’s reaction to January’s report was limit up; did you know that in 2008 the corn market was limit up on the same report?
July ’21 corn’s limit up settlement was 516’2; did you know that the limit up settlement the day of the January 2008 report for July ’08 corn was 516’0?
Both contracts gapped higher the night session after the report and peaked. The peak for the July ’21 contract on that particular day was 540’2; the peak for the July ’08 contract was 542’2. Both years made a low of 490’0, on the dot, after the post-report peak.
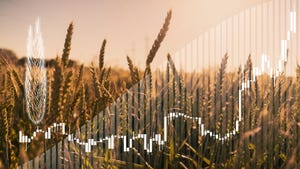
Look for yourself on the chart below.
July ’08 is represented by the green and red bars while July ’21 is represented by the white and blue bars. The sequence of events just discussed is within the circle. At this point, the two charts at current levels are almost undistinguishable.

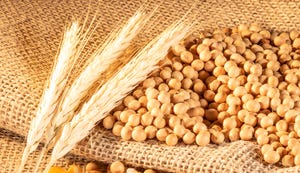
What about soybeans? Good question. Just look at March ’08 soybeans versus March ’21.
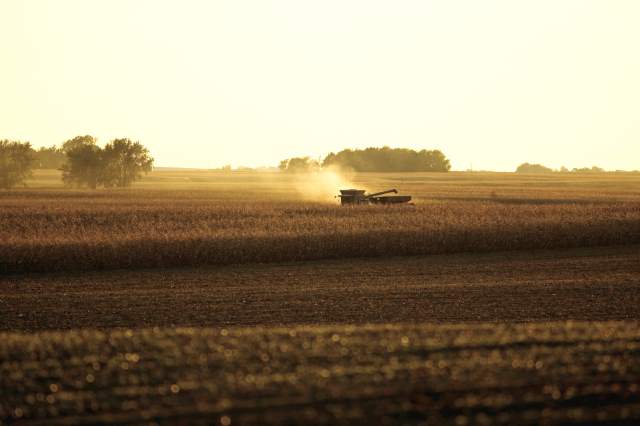
Expectations for next week’s February WASDE USDA report are for ending stocks of both corn and soybeans to be reduced based on the pace of export commitments versus the pace needed to hit USDA’s current marketing year target.

But, in order to accommodate significantly lower production, last month’s report reduced corn demand by 250 million bushels; 100 million bushels of that adjustment was export demand.
This adjustment by the USDA would suggest that higher prices are rationing demand, but just last week China’s corn purchases were roughly 145 million bushels.
America’s cheap corn
U.S.-origin corn is still the cheapest in the world and the price of corn in China is still $5 per bushel higher than the $6 price level China enjoyed domestically when their stocks were adequate. We believe China’s goal is to rebuild domestic stockpiles until prices are back to that level, and it will require more U.S. corn.
Should the USDA make the adjustments we feel are necessary, the stocks-to-use ratios will rival previous years where prices were significantly higher than current levels. This belief, along with the stunning similarities to 2008, would suggest that prices will continue to push higher through the remainder of February and will reach a major peak at the beginning of March as we head into the end of the 1st quarter of 2021.
At this point, the market will have likely priced in the bullishness of the report and will be vulnerable to profit taking by funds into quarter’s end, especially as trade begins to focus more and more on anticipated plantings this spring.
That Planting Intentions report is at the very end of March, and in 2008, forged some major lows. But beware; if 2008 continues to be a roadmap, the move in soybeans from the March peak to the April low could be a doozy, to the tune of $4.80 peak to trough.
Looking at puts?
So if corn and soybean continue to rally into month’s end, you better believe we’ll be looking very hard at puts for the potential break during the month of March.
But guess what -- that break was a heck of a buying opportunity heading into summer. So, while past performance is not indicative of future results, I’m using the 2008 roadmap until it puts me in a ditch.
Feel free to contact me directly at 815-665-0463 or anyone on the AgMarket.Net team at 844-4AGMRKT.
Read more about:
Grain MarketsYou May Also Like
Enter a zip code to see the weather conditions for a different location.